Technical Analysis of XAR 2024-05-10
Overview:
In analyzing the technical indicators for XAR over the last 5 days, we will delve into the trend, momentum, volatility, and volume indicators to provide a comprehensive outlook on the possible stock price movement in the coming days. By examining these key aspects, we aim to offer valuable insights and predictions for potential investors.
Trend Analysis:
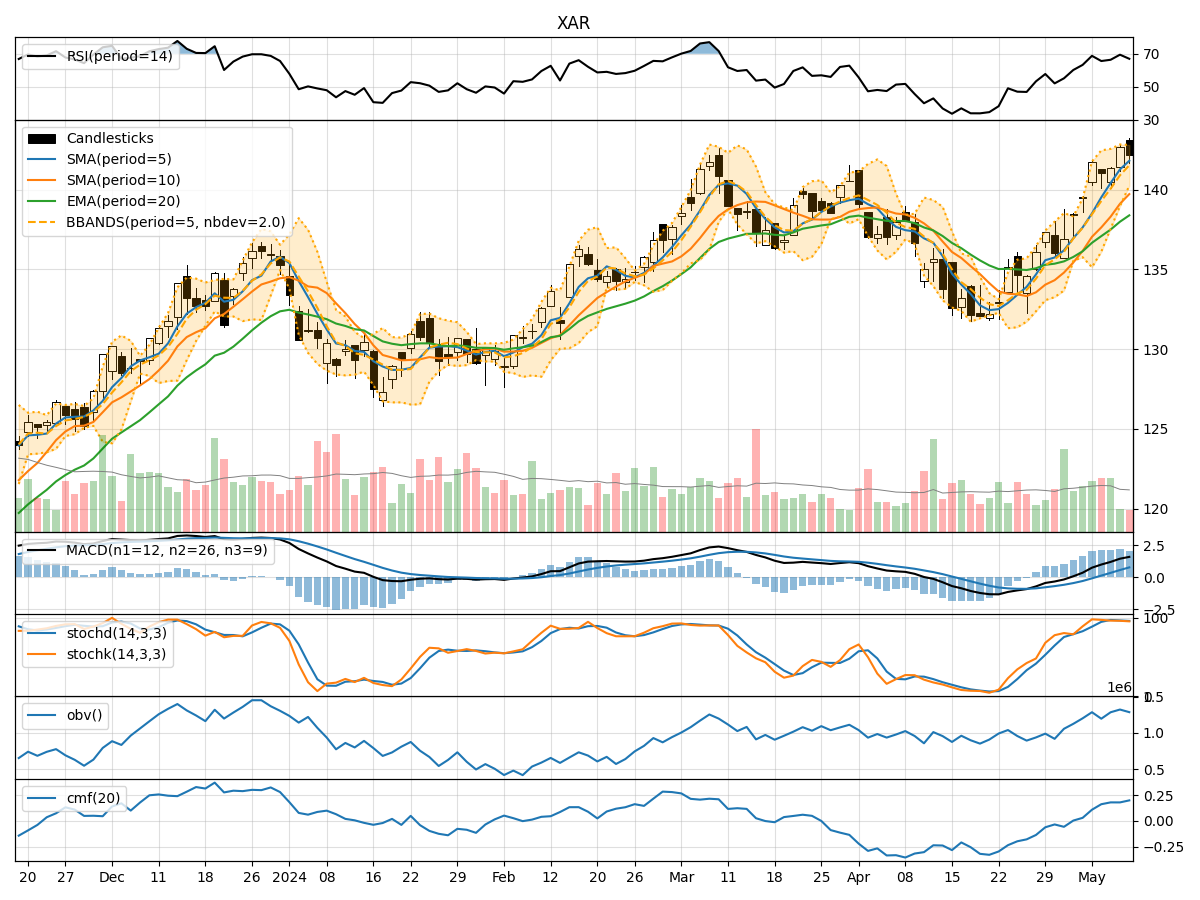
- Moving Averages (MA): The 5-day Moving Average (MA) has been consistently above the 10-day Simple Moving Average (SMA), indicating a short-term bullish trend.
- Exponential Moving Average (EMA): The EMA has been steadily increasing, reflecting positive price momentum.
- MACD: The MACD line has been above the signal line, suggesting bullish momentum in the stock price.
Key Observation: The trend indicators point towards a bullish sentiment in the short term.
Momentum Analysis:
- Relative Strength Index (RSI): The RSI has been fluctuating around the overbought territory, indicating strong buying pressure.
- Stochastic Oscillator: Both %K and %D lines of the Stochastic Oscillator have been in the overbought zone, signaling potential price strength.
- Williams %R (Willams %R): The Williams %R has been hovering in the oversold region, suggesting a possible reversal.
Key Observation: Momentum indicators suggest a mixed sentiment with overbought conditions but also potential for a reversal.
Volatility Analysis:
- Bollinger Bands (BB): The stock price has been trading within the upper Bollinger Band, indicating increased volatility.
- Bollinger Band Width (BBW): The BBW has been relatively narrow, suggesting a period of consolidation.
- Bollinger Band %B (BBP): The %B has been fluctuating around 0.5, indicating a balanced market sentiment.
Key Observation: Volatility indicators suggest a consolidation phase with potential for a breakout.
Volume Analysis:
- On-Balance Volume (OBV): The OBV has shown mixed signals with fluctuations in volume, indicating indecision among market participants.
- Chaikin Money Flow (CMF): The CMF has been positive, suggesting buying pressure in the market.
Key Observation: Volume indicators reflect indecisiveness among traders with a slight bias towards buying pressure.
Conclusion:
Based on the analysis of the technical indicators, the next few days for XAR could see upward price movement in the short term, supported by the bullish trend indicators. However, the mixed momentum signals and consolidation in volatility indicate a potential for sideways movement or a minor correction before a possible continuation of the uptrend. Traders should closely monitor key support and resistance levels for confirmation of the anticipated price action.
Recommendation:
- Short-term Traders: Consider entering long positions with tight stop-loss orders to capitalize on the potential upward movement.
- Long-term Investors: Monitor the price action for a possible entry point during consolidation phases for a more favorable risk-reward ratio.
By combining insights from trend, momentum, volatility, and volume indicators, investors can make informed decisions aligned with the current market dynamics and technical signals.