Technical Analysis of XBI 2024-05-10
Overview:
In analyzing the technical indicators for XBI over the last 5 days, we will delve into the trend, momentum, volatility, and volume indicators to gain a comprehensive understanding of the stock's potential price movement. By examining these key factors, we aim to provide valuable insights and predictions for the next few days.
Trend Analysis:
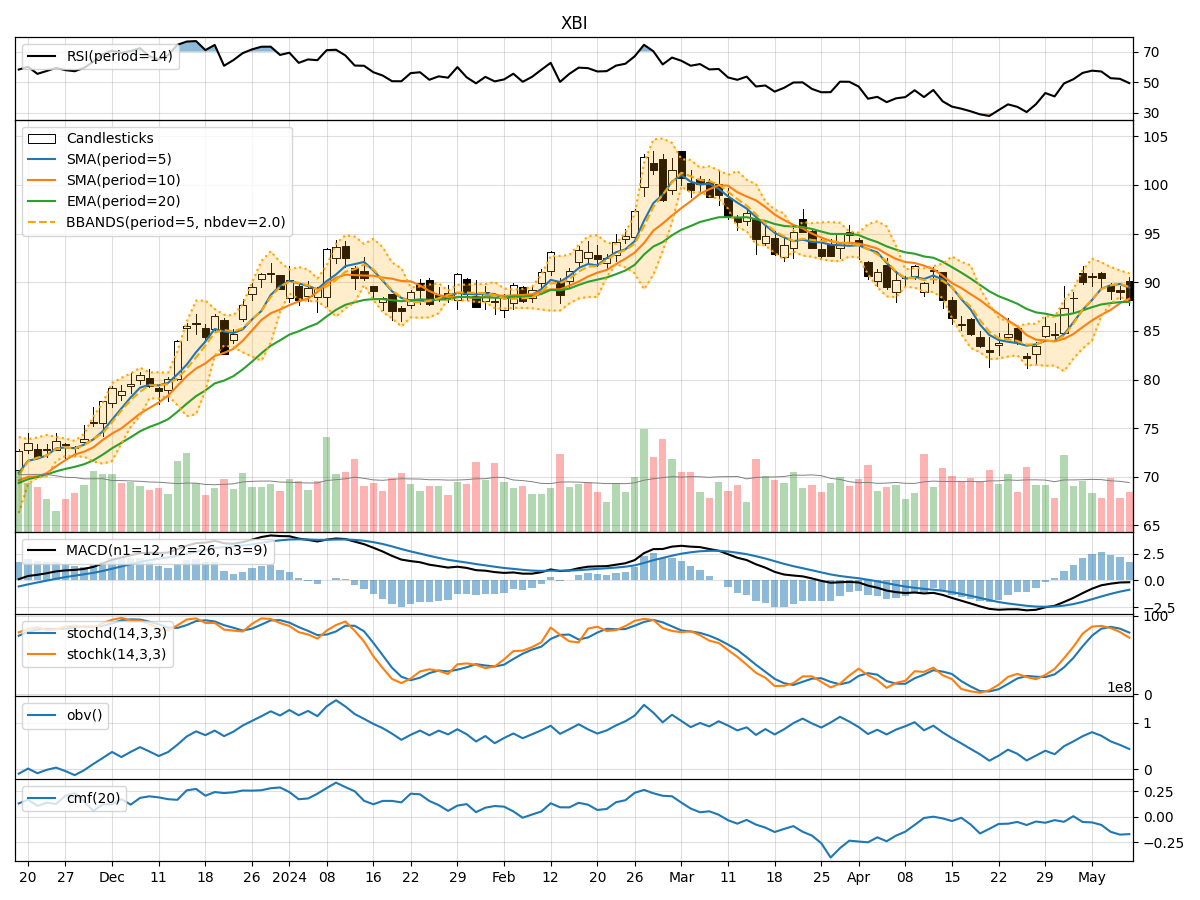
- Moving Averages (MA): The 5-day Moving Average (MA) has been fluctuating around the 88-89 range, indicating a relatively stable trend in the short term.
- MACD: The Moving Average Convergence Divergence (MACD) has shown a decreasing trend in the MACD line, suggesting a potential bearish signal.
- EMA: The Exponential Moving Average (EMA) has been relatively flat, indicating a lack of strong directional bias in the longer term.
Momentum Analysis:
- RSI: The Relative Strength Index (RSI) has been hovering around the mid-50s, indicating a neutral momentum with no extreme overbought or oversold conditions.
- Stochastic Oscillator: Both %K and %D of the Stochastic Oscillator have been declining, signaling a potential weakening momentum.
- Williams %R: The Williams %R is in the oversold territory, suggesting a bearish sentiment in the short term.
Volatility Analysis:
- Bollinger Bands: The Bollinger Bands have been narrowing, indicating decreasing volatility and a potential upcoming breakout.
- Bollinger %B: The %B indicator is relatively low, suggesting a possible oversold condition.
Volume Analysis:
- On-Balance Volume (OBV): The OBV has been declining over the past few days, indicating selling pressure and a bearish sentiment.
- Chaikin Money Flow (CMF): The CMF has been negative, reflecting a lack of buying interest and potential distribution.
Key Observations:
- The trend indicators show a lack of strong directional bias, with a potential bearish signal from the MACD.
- Momentum indicators suggest a neutral to bearish sentiment, with the Williams %R in the oversold territory.
- Volatility is decreasing, indicating a potential upcoming breakout.
- Volume indicators point towards selling pressure and a lack of buying interest.
Conclusion:
Based on the analysis of the technical indicators, the next few days for XBI are likely to see further downward movement. The bearish signals from the MACD, Stochastic Oscillator, and OBV, combined with the oversold condition of the Williams %R, indicate a potential continuation of the current downward trend. Traders and investors should exercise caution and consider short-term bearish strategies until a clear reversal pattern emerges.