Technical Analysis of XBJL 2024-05-10
Overview:
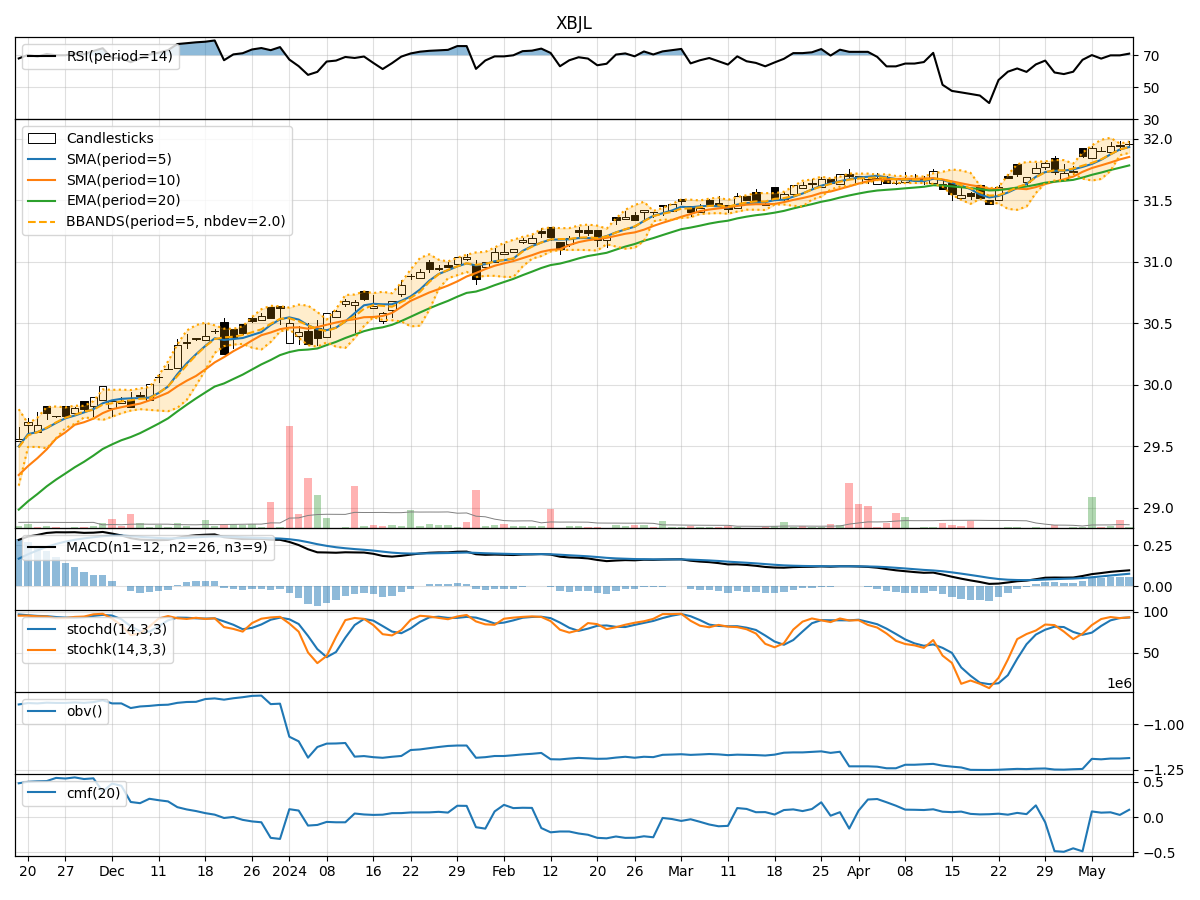
In analyzing the technical indicators for XBJL stock over the last 5 days, we will delve into the trend, momentum, volatility, and volume indicators to provide a comprehensive outlook on the possible stock price movement in the coming days. By examining these key indicators, we aim to offer valuable insights and predictions for potential investors.
Trend Analysis:
- Moving Averages (MA): The 5-day Moving Average (MA) has been consistently above the Simple Moving Average (SMA) and Exponential Moving Average (EMA), indicating a bullish trend.
- MACD: The MACD line has been consistently above the signal line, with both lines showing an upward trend, suggesting bullish momentum.
Momentum Analysis:
- RSI: The Relative Strength Index (RSI) has been hovering around 70, indicating a slightly overbought condition but still within a reasonable range.
- Stochastic Oscillator: Both %K and %D have been in the overbought zone, suggesting a strong bullish momentum.
Volatility Analysis:
- Bollinger Bands (BB): The stock price has been trading within the Bollinger Bands, with the bands narrowing, indicating decreasing volatility.
Volume Analysis:
- On-Balance Volume (OBV): The OBV has been fluctuating but has not shown a clear trend, indicating mixed sentiment among investors.
- Chaikin Money Flow (CMF): The CMF has been positive, suggesting that money is flowing into the stock over the 20-day period.
Key Observations:
- The trend indicators suggest a strong bullish sentiment, supported by the moving averages and MACD.
- Momentum indicators indicate a slightly overbought condition but with strong bullish momentum.
- Volatility has been decreasing, as shown by the narrowing Bollinger Bands.
- Volume indicators show mixed sentiment, with OBV fluctuating and CMF indicating positive money flow.
Conclusion:
Based on the analysis of the technical indicators, the stock is likely to continue its upward movement in the coming days. The bullish trend, strong momentum, decreasing volatility, and positive money flow all point towards further price appreciation. Investors may consider buying or holding XBJL stock for potential gains in the short to medium term.
Disclaimer:
This analysis is based solely on technical indicators and historical data. It is essential to consider other fundamental factors and market dynamics before making any investment decisions. Consulting with a financial advisor is recommended to align investments with individual goals and risk tolerance levels.