Technical Analysis of XC 2024-05-10
Overview:
In analyzing the technical indicators for XC stock over the last 5 days, we will delve into the trend, momentum, volatility, and volume indicators to provide a comprehensive outlook on the possible stock price movement in the coming days.
Trend Analysis:
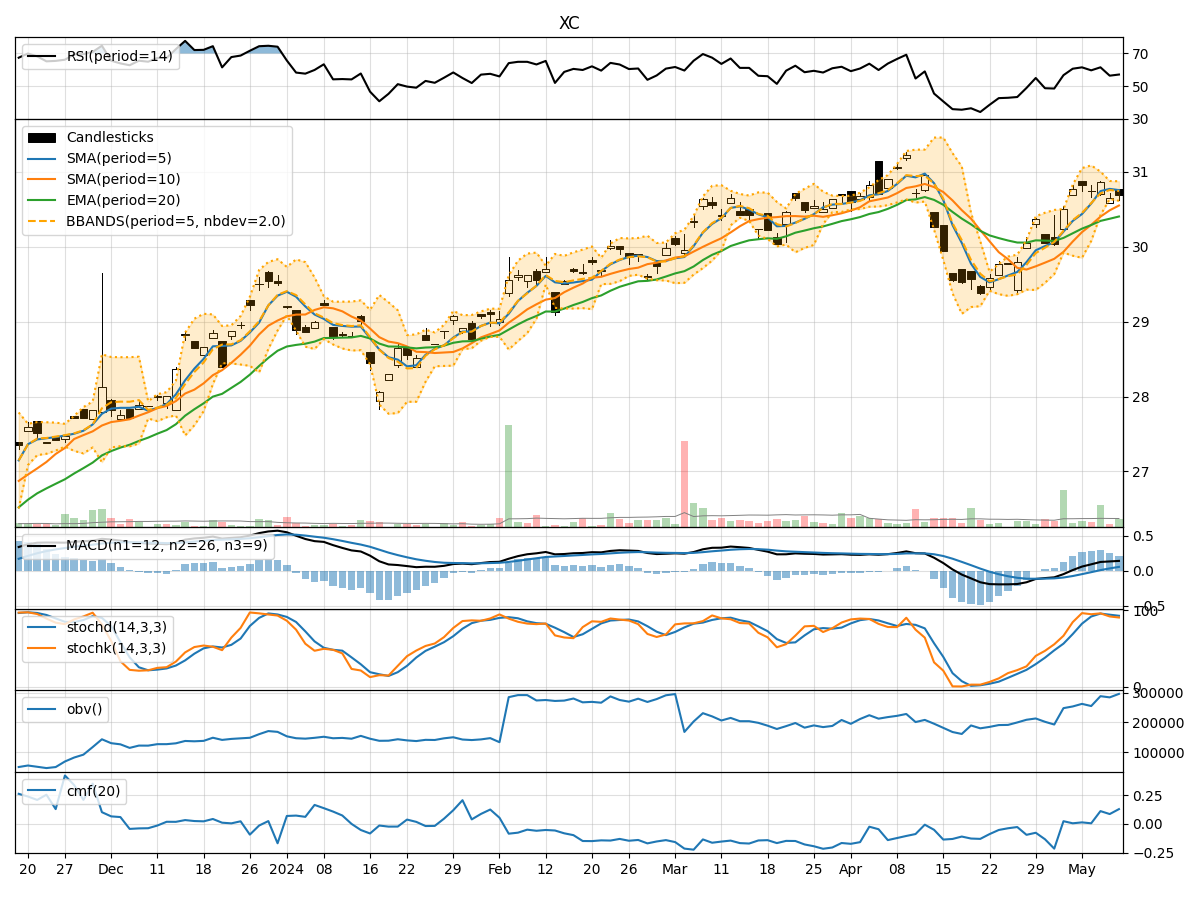
- Moving Averages (MA): The 5-day Moving Average (MA) has been consistently above the Simple Moving Average (SMA) and Exponential Moving Average (EMA), indicating a bullish trend.
- MACD: The MACD line has been consistently above the signal line, with the MACD Histogram showing an increasing positive trend, suggesting bullish momentum.
Momentum Analysis:
- RSI: The Relative Strength Index (RSI) has been fluctuating around the 50 level, indicating a neutral momentum.
- Stochastic Oscillator: Both %K and %D have been hovering around the overbought territory, suggesting a potential reversal or consolidation.
Volatility Analysis:
- Bollinger Bands (BB): The stock price has been trading within the Bollinger Bands, with the bands narrowing, indicating decreasing volatility.
- Bollinger %B: The %B indicator has been fluctuating around the midline, suggesting a lack of clear direction in price movement.
Volume Analysis:
- On-Balance Volume (OBV): The OBV has shown mixed signals, with some days experiencing selling pressure and others showing buying interest.
- Chaikin Money Flow (CMF): The CMF has been positive, indicating accumulation in the stock.
Conclusion:
Based on the analysis of the technical indicators: - Trend: The stock is in an upward trend, supported by the moving averages and MACD. - Momentum: The momentum is neutral with potential signs of overbought conditions. - Volatility: Volatility is decreasing, suggesting a possible period of consolidation. - Volume: The volume indicators show mixed signals but with a slight bullish bias.
Future Price Movement Prediction:
Considering the overall analysis, the next few days' possible stock price movement for XC is likely to be sideways with a slight upward bias. Traders should watch for a potential consolidation phase with limited price fluctuations. It is advisable to monitor key support and resistance levels for potential breakout or breakdown scenarios.