Technical Analysis of XCOR 2024-05-10
Overview:
In analyzing the technical indicators for XCOR over the last 5 days, we will delve into the trend, momentum, volatility, and volume indicators to provide a comprehensive outlook on the possible stock price movement in the coming days. By examining these key aspects, we aim to offer valuable insights and predictions for potential investors.
Trend Indicators:
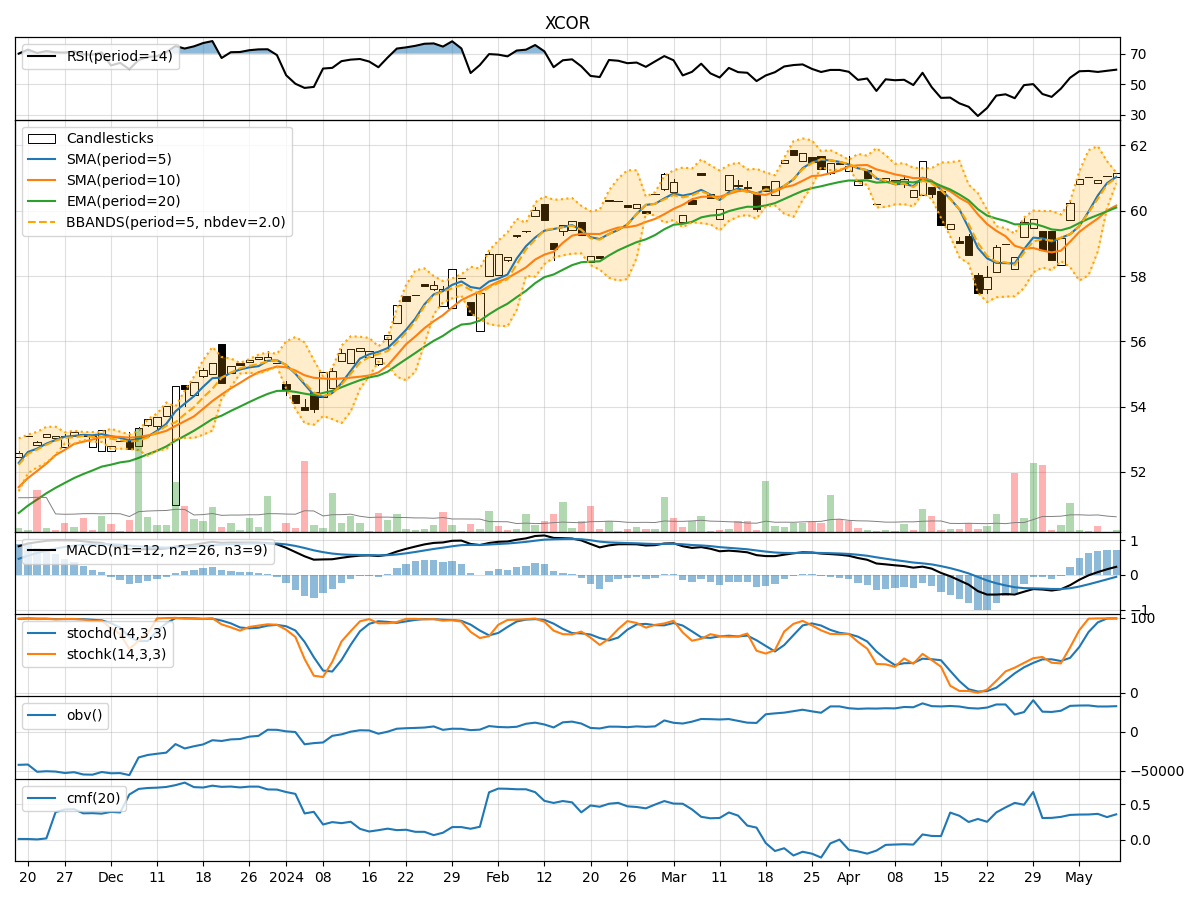
- Moving Averages (MA): The 5-day moving average has been consistently above the simple moving average (SMA) and exponential moving average (EMA), indicating a bullish trend.
- MACD: The MACD line has been consistently above the signal line, suggesting a positive momentum in the stock price.
Momentum Indicators:
- RSI: The Relative Strength Index (RSI) has been in the overbought territory, indicating a strong bullish momentum.
- Stochastic Oscillator: Both %K and %D have been at extremely high levels, signaling a potential overbought condition.
Volatility Indicators:
- Bollinger Bands (BB): The stock price has been consistently trading above the middle Bollinger Band, indicating an upward trend with low volatility.
Volume Indicators:
- On-Balance Volume (OBV): The OBV has shown a slight increase, suggesting a positive accumulation of the stock.
- Chaikin Money Flow (CMF): The CMF has been positive, indicating buying pressure in the stock.
Key Observations and Opinions:
- Trend: The stock is in a strong bullish trend based on moving averages and MACD.
- Momentum: The RSI and Stochastic Oscillator suggest an overbought condition, which may lead to a potential pullback.
- Volatility: The stock has exhibited low volatility with a consistent upward movement.
- Volume: The OBV and CMF indicate positive buying pressure and accumulation of the stock.
Conclusion:
Based on the analysis of the technical indicators, the next few days' possible stock price movement for XCOR is likely to be sideways to slightly bearish. The overbought signals from the momentum indicators suggest a potential correction or consolidation in the stock price. Investors should exercise caution and consider waiting for a better entry point before initiating new positions.