Technical Analysis of XDAP 2024-05-10
Overview:
In analyzing the XDAP stock using technical indicators over the last 5 days, we will delve into the trend, momentum, volatility, and volume indicators to provide a comprehensive outlook on the possible stock price movement. By examining these key indicators, we aim to offer valuable insights and predictions for the upcoming days.
Trend Indicators:
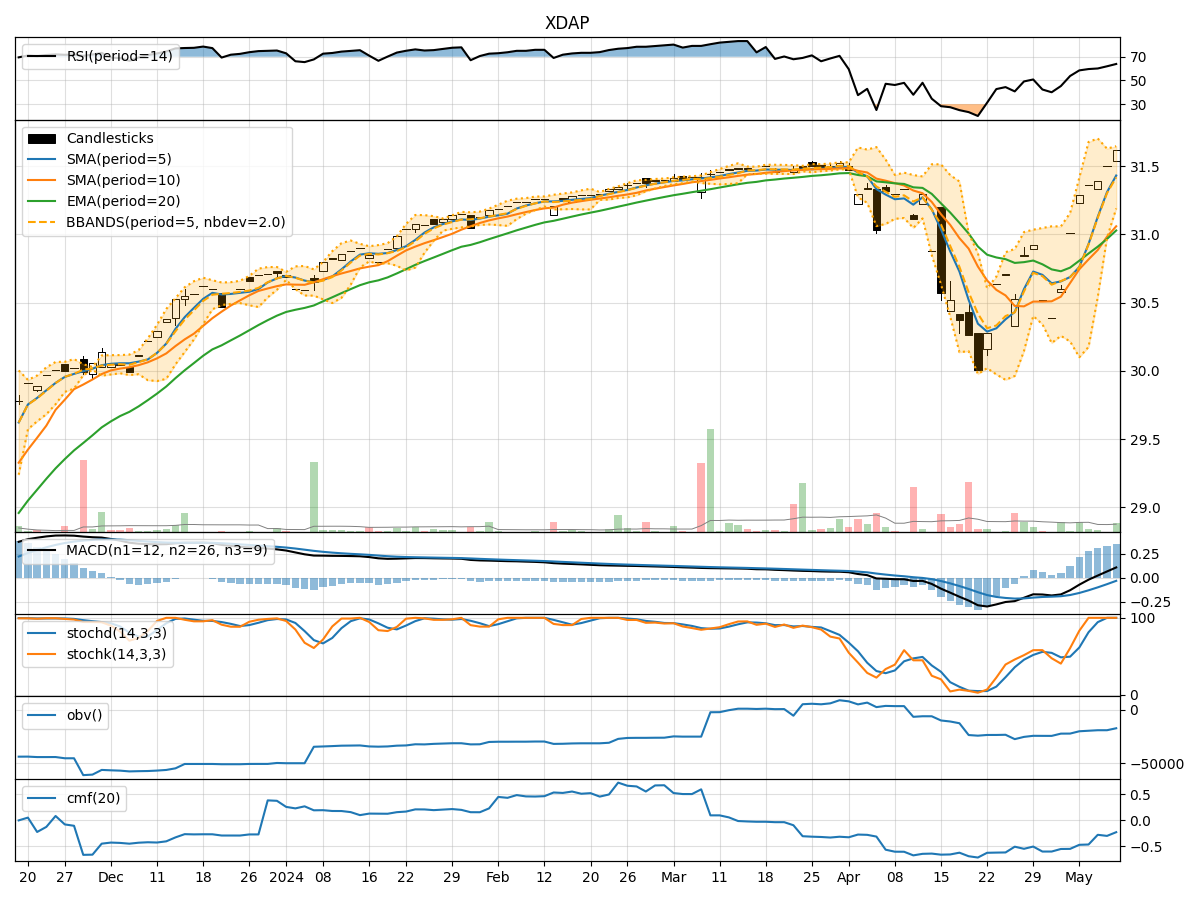
- Moving Averages (MA): The 5-day MA has been consistently above the 10-day SMA, indicating a short-term bullish trend.
- MACD: The MACD line has been above the signal line for the past 5 days, suggesting a bullish momentum.
- RSI: The RSI has been gradually increasing and is currently in the overbought territory, signaling a strong bullish sentiment.
Momentum Indicators:
- Stochastic Oscillator: Both %K and %D have been at 100% for the last 3 days, indicating strong upward momentum.
- Williams %R: The indicator has been consistently at 0, reflecting a strong bullish sentiment.
Volatility Indicators:
- Bollinger Bands (BB): The stock price has been trading within the upper Bollinger Band, indicating high volatility and potential overbought conditions.
- BB% (BB Percentage): The BB% has been above 0.8 for the last 3 days, suggesting a high likelihood of a price reversal.
Volume Indicators:
- On-Balance Volume (OBV): The OBV has been steadily increasing, indicating strong buying pressure.
- Chaikin Money Flow (CMF): The CMF has been negative for the past 5 days, suggesting a bearish money flow trend.
Key Observations and Opinions:
- Trend: The trend indicators suggest a strong bullish sentiment in the short term.
- Momentum: Momentum indicators confirm the bullish trend with strong upward momentum.
- Volatility: High volatility and potential overbought conditions indicated by the Bollinger Bands and BB%.
- Volume: Increasing OBV signals strong buying pressure, while the negative CMF indicates a bearish money flow trend.
Conclusion:
Based on the analysis of the technical indicators, the XDAP stock is strongly bullish in the short term. The stock is likely to experience further upward movement in the coming days, driven by strong momentum and buying pressure. Traders and investors may consider buying opportunities in line with the current bullish trend. However, caution is advised due to the high volatility and potential overbought conditions indicated by the Bollinger Bands.