Technical Analysis of XDAT 2024-05-10
Overview:
In analyzing the provided Technical Analysis (TA) data for the last 5 days of XDAT stock, we will delve into the trend, momentum, volatility, and volume indicators to derive insights into the possible future stock price movement. By examining these key indicators, we aim to provide a comprehensive analysis and make informed predictions for the upcoming days.
Trend Analysis:
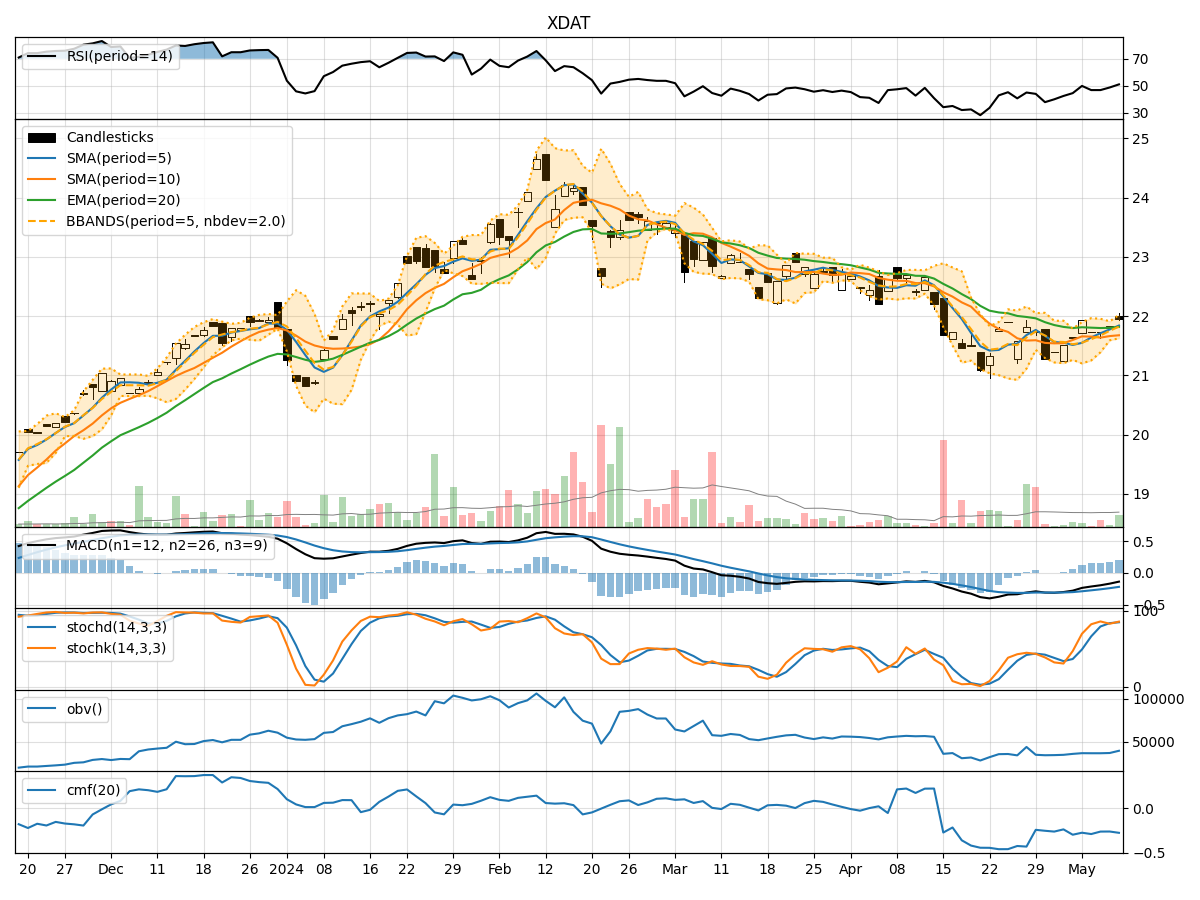
- Moving Averages (MA): The 5-day Moving Average (MA) has been showing an upward trend, indicating a positive momentum in the stock price.
- MACD: The Moving Average Convergence Divergence (MACD) has been consistently negative but with a slight increase in the MACD histogram, suggesting a potential reversal in the short term.
Momentum Analysis:
- RSI: The Relative Strength Index (RSI) has been fluctuating around the neutral zone, indicating a balanced momentum in the stock.
- Stochastic Oscillator: Both %K and %D of the Stochastic Oscillator are in the overbought region, signaling a potential reversal or consolidation phase.
Volatility Analysis:
- Bollinger Bands (BB): The Bollinger Bands are narrowing, indicating decreasing volatility in the stock price.
- Bollinger Band %B: The %B indicator is hovering around 0.5, suggesting a neutral stance in terms of volatility.
Volume Analysis:
- On-Balance Volume (OBV): The OBV has been declining, indicating a potential distribution phase in the stock.
- Chaikin Money Flow (CMF): The CMF is negative, reflecting a bearish sentiment in terms of volume flow.
Key Observations:
- The trend indicators suggest a potential bullish bias in the short term.
- Momentum indicators show a mixed signal with a possibility of a reversal or consolidation.
- Volatility indicators point towards decreasing volatility in the stock price.
- Volume indicators indicate a bearish sentiment in terms of volume flow.
Conclusion:
Based on the analysis of the technical indicators, the next few days' possible stock price movement for XDAT is likely to be sideways with a slight upward bias. While the trend indicators signal a bullish outlook, the mixed momentum and bearish volume indicators suggest a potential consolidation phase or limited upside movement. Traders should closely monitor key support and resistance levels for potential entry and exit points in the stock.