Technical Analysis of XDEC 2024-05-10
Overview:
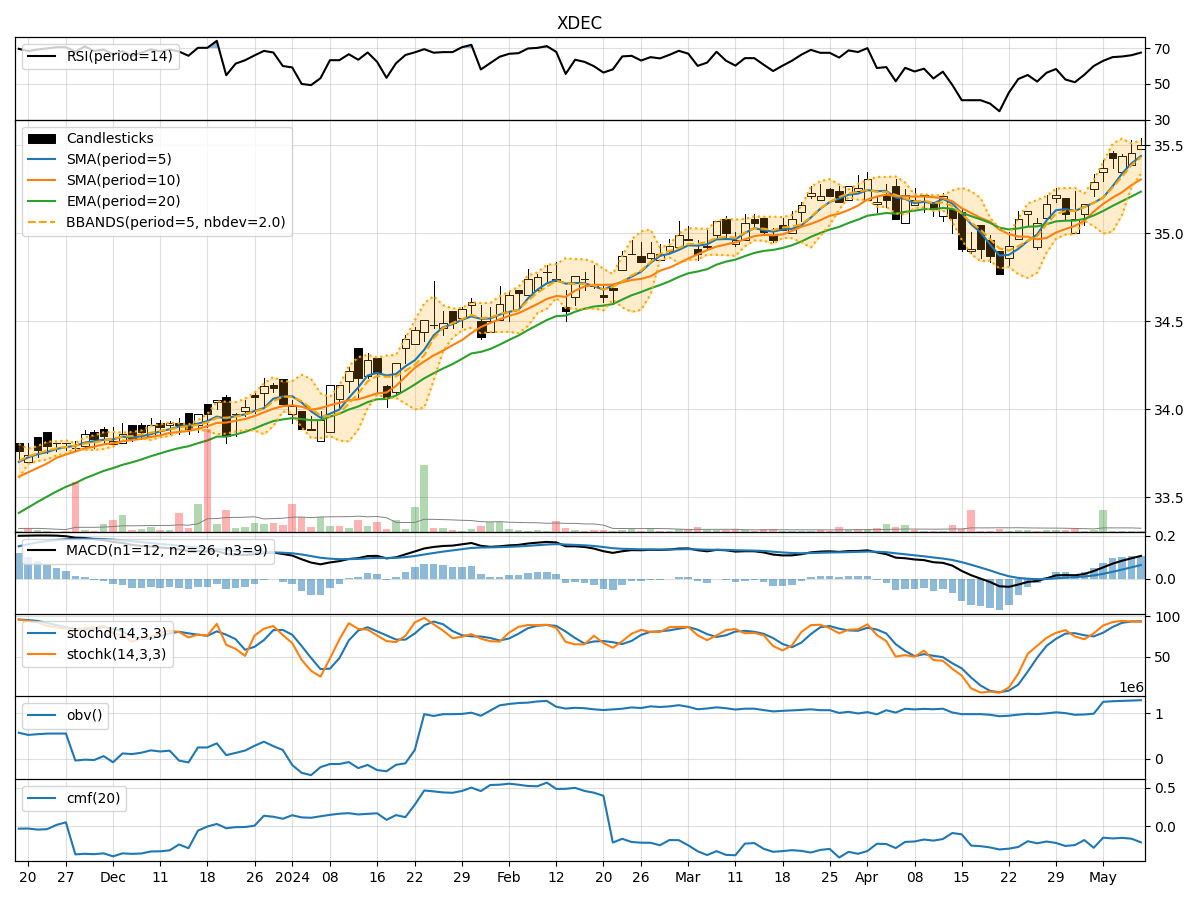
In analyzing the technical indicators for XDEC stock over the last 5 days, we will delve into the trend, momentum, volatility, and volume indicators to provide a comprehensive outlook on the possible stock price movement in the coming days. By examining these key indicators, we aim to offer valuable insights and predictions for potential investors.
Trend Analysis:
- Moving Averages (MA): The 5-day Moving Average (MA) has been consistently above the Simple Moving Average (SMA) and Exponential Moving Average (EMA), indicating a bullish trend.
- MACD: The MACD line has been steadily increasing, with the MACD histogram also showing positive values, suggesting upward momentum.
Momentum Analysis:
- RSI: The Relative Strength Index (RSI) has been trending upwards, indicating increasing buying pressure.
- Stochastic Oscillator: Both %K and %D values of the Stochastic Oscillator are in the overbought zone, suggesting a potential reversal or consolidation.
Volatility Analysis:
- Bollinger Bands (BB): The stock price has been trading within the Bollinger Bands, with the bands narrowing, indicating reduced volatility.
Volume Analysis:
- On-Balance Volume (OBV): The OBV has been increasing, suggesting accumulation by investors.
- Chaikin Money Flow (CMF): The CMF has been negative, indicating selling pressure in the market.
Key Observations:
- The trend indicators suggest a strong bullish sentiment in the short term.
- Momentum indicators show potential overbought conditions, signaling a possible correction or consolidation.
- Volatility has been decreasing, indicating a period of stability in the stock price.
- Volume indicators reflect mixed signals with OBV showing accumulation but CMF indicating selling pressure.
Conclusion:
Based on the analysis of the technical indicators, the next few days' possible stock price movement for XDEC is likely to continue in an upward direction due to the bullish trend and positive momentum. However, caution is advised as the stock may experience a short-term correction or consolidation given the overbought signals from the momentum indicators. Investors should closely monitor the price action and consider taking profits or implementing risk management strategies to navigate potential market fluctuations.