Technical Analysis of XDJA 2024-05-10
Overview:
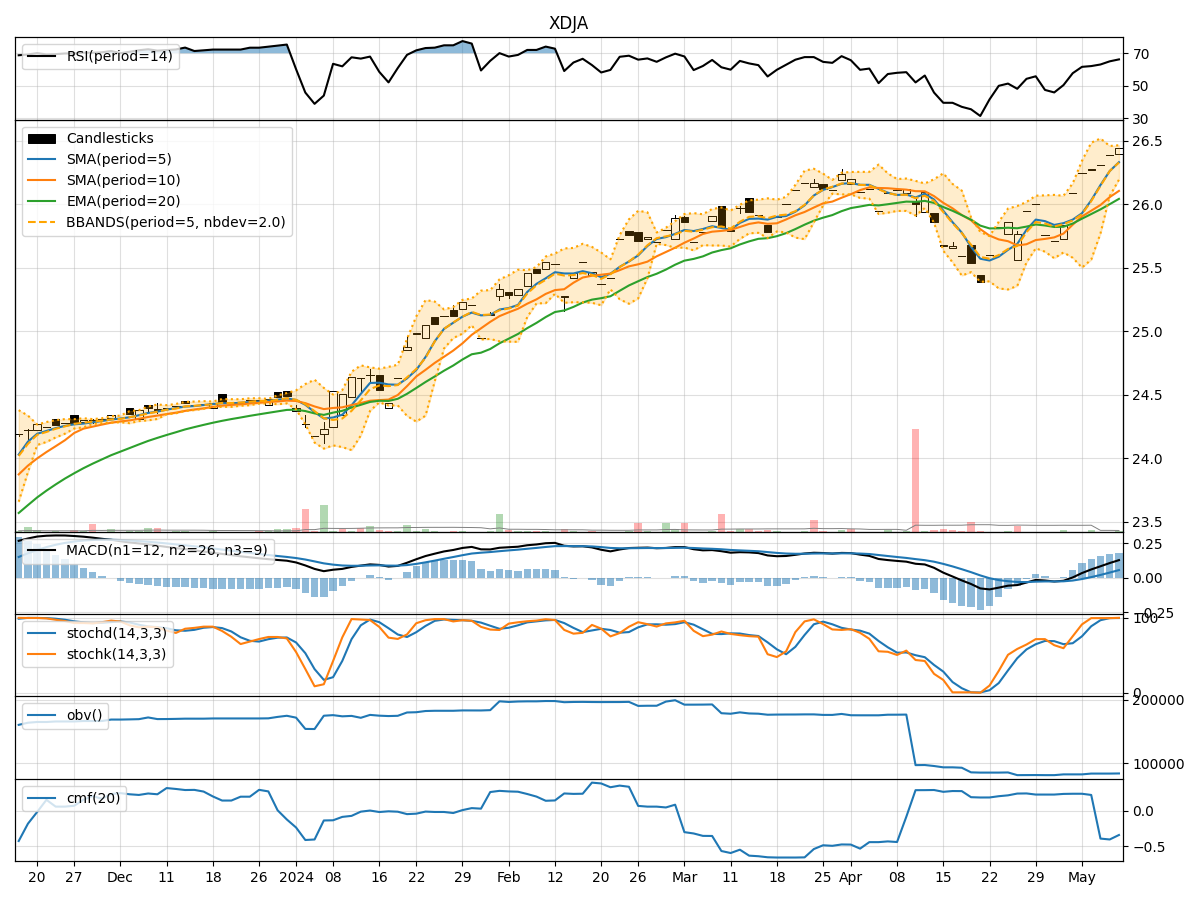
In analyzing the XDJA stock using technical indicators over the last 5 days, we will delve into the trend, momentum, volatility, and volume indicators to provide a comprehensive outlook on the possible stock price movement. By examining these key aspects, we aim to offer valuable insights and predictions for the upcoming days.
Trend Indicators:
- Moving Averages (MA): The 5-day MA has been consistently above the closing price, indicating a bullish trend.
- MACD: The MACD line has been steadily increasing, showing positive momentum in the stock price.
- MACD Histogram: The histogram has been rising, suggesting an uptrend in momentum.
Key Observation: The trend indicators point towards a bullish sentiment in the stock price movement.
Momentum Indicators:
- RSI: The RSI has been gradually increasing, indicating strengthening momentum.
- Stochastic Oscillator: Both %K and %D have been near or at 100, signaling strong buying pressure.
- Williams %R: The indicator has consistently been at or near oversold levels, suggesting a potential reversal.
Key Observation: Momentum indicators reflect a strong bullish sentiment in the stock.
Volatility Indicators:
- Bollinger Bands: The bands have been narrowing, indicating decreasing volatility.
- Bollinger %B: The %B has been increasing, suggesting a potential breakout.
- Average True Range (ATR): ATR has been decreasing, indicating lower volatility.
Key Observation: Volatility indicators point towards a potential breakout due to decreasing volatility.
Volume Indicators:
- On-Balance Volume (OBV): The OBV has been slightly decreasing, indicating some distribution.
- Chaikin Money Flow (CMF): CMF has been negative, suggesting outflow of money from the stock.
Key Observation: Volume indicators show a slight bearish sentiment due to decreasing OBV and negative CMF.
Conclusion:
Based on the analysis of trend, momentum, volatility, and volume indicators, the overall outlook for XDJA stock is bullish with strong momentum and a potential breakout in volatility. However, there are signs of slight distribution in volume, which could lead to short-term fluctuations. Considering the bullish trend and momentum, the stock is likely to experience upward movement in the next few days. Traders may consider entering long positions to capitalize on the expected price appreciation.