Technical Analysis of XDJL 2024-05-10
Overview:
In analyzing the technical indicators for XDJL over the last 5 days, we will delve into the trend, momentum, volatility, and volume indicators to provide a comprehensive outlook on the possible stock price movement in the coming days. By examining these key indicators, we aim to offer valuable insights and predictions for informed decision-making.
Trend Indicators:
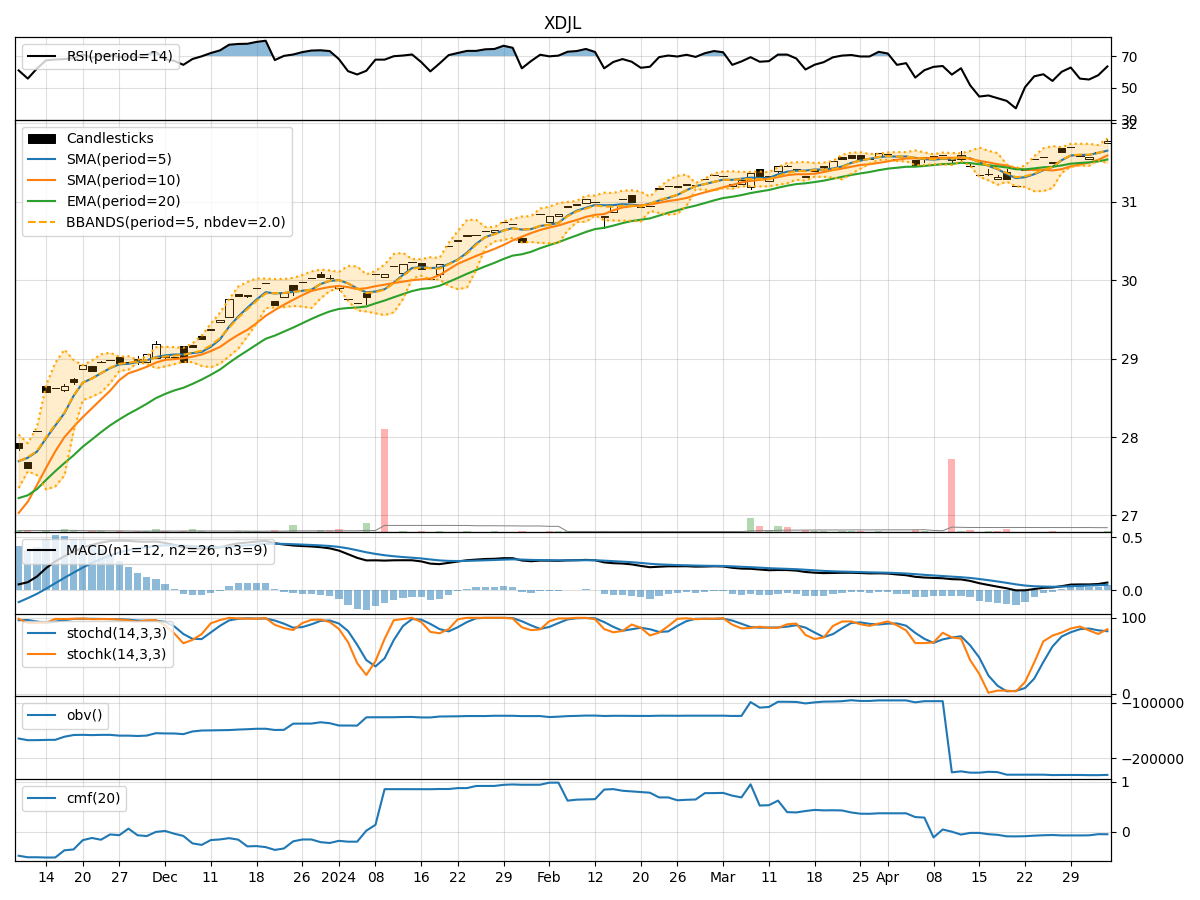
- Moving Averages (MA): The 5-day MA has been consistently above the closing prices, indicating a bullish trend.
- MACD: The MACD line has been above the signal line, suggesting a bullish momentum.
- EMA: The EMA has been trending upwards, supporting the bullish sentiment.
Momentum Indicators:
- RSI: The RSI has been in the overbought territory, indicating a strong bullish momentum.
- Stochastic Oscillator: Both %K and %D have been at 100, signaling an extremely overbought condition.
- Williams %R: The indicator has consistently been at 0, reflecting a strong bullish sentiment.
Volatility Indicators:
- Bollinger Bands: The bands have been narrowing, suggesting decreasing volatility.
- Bollinger %B: The %B has been increasing, indicating a potential bullish breakout.
Volume Indicators:
- On-Balance Volume (OBV): The OBV has been relatively stable, showing no significant divergence.
- Chaikin Money Flow (CMF): The CMF has been negative, indicating some selling pressure.
Key Observations:
- The trend indicators, momentum indicators, and volatility indicators all point towards a bullish sentiment in the market.
- The volume indicators, specifically the CMF, suggest a slight bearish pressure due to negative money flow.
Conclusion:
Based on the analysis of the technical indicators, the next few days' possible stock price movement for XDJL is likely to be upward with a bullish bias. Traders and investors may consider taking long positions or holding onto existing positions to capitalize on the expected price appreciation. However, it is essential to monitor the volume closely for any signs of divergence or reversal in the bullish trend.