Technical Analysis of XDOC 2024-05-10
Overview:
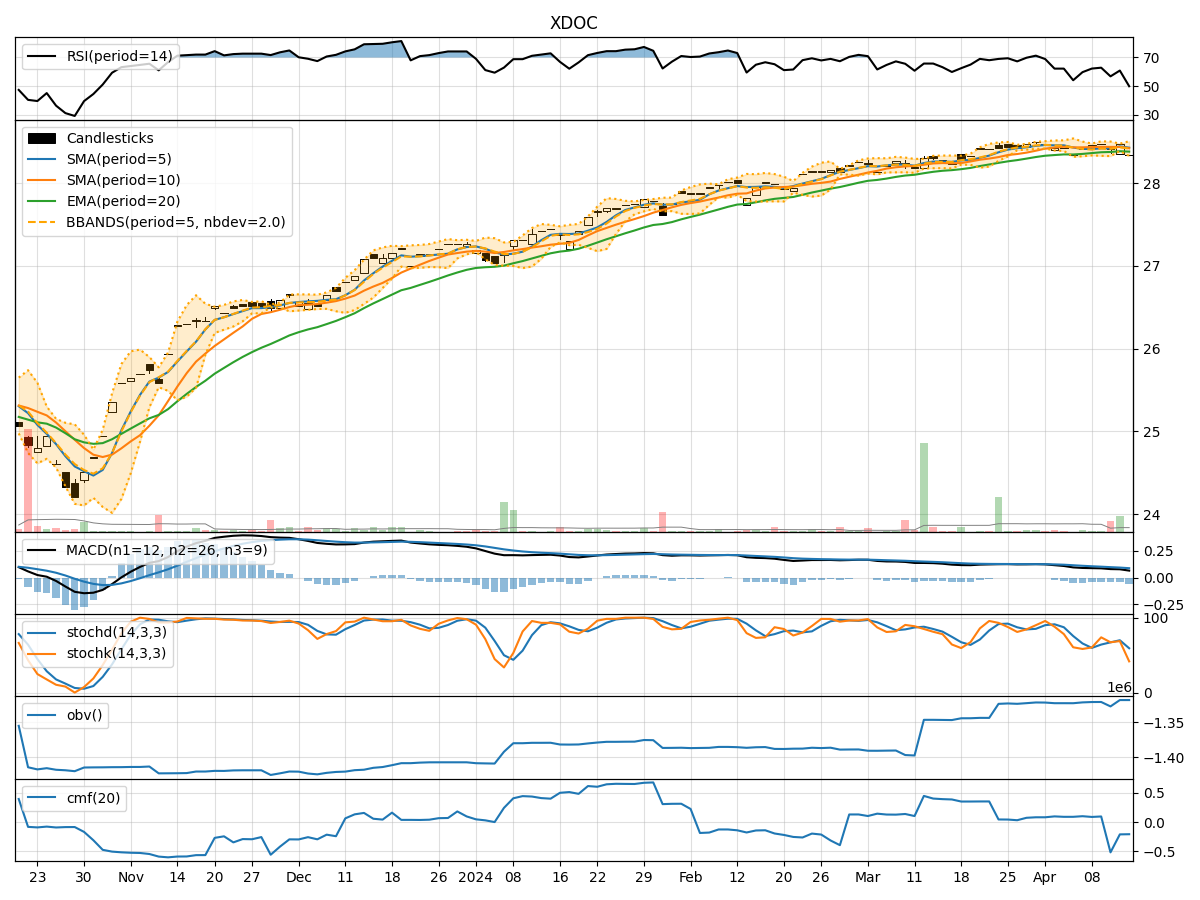
In the last 5 trading days, XDOC stock has shown a consistent uptrend in its closing price, accompanied by increasing trading volumes. The moving averages have been trending upwards, indicating a positive momentum. The MACD and RSI are also showing bullish signals. However, the stock is currently trading near its upper Bollinger Band, suggesting a potential overbought condition. Let's delve deeper into each category of technical indicators to provide a comprehensive analysis and make a prediction for the next few days.
Trend Indicators:
- Moving Averages (MA): The 5-day MA has been consistently above the 10-day SMA, indicating a short-term bullish trend. The EMA(20) is also trending upwards, supporting the bullish momentum.
- MACD: The MACD line has been above the signal line for the past 5 days, indicating a bullish trend. The MACD histogram is also showing an increasing positive value, suggesting strengthening bullish momentum.
Momentum Indicators:
- RSI: The RSI has been consistently above 50 and is trending upwards, indicating increasing buying pressure. However, it is important to note that the RSI is approaching overbought levels, which could lead to a potential reversal.
- Stochastic Oscillator: Both %K and %D lines of the Stochastic Oscillator are in the overbought zone, suggesting that the stock may be overvalued in the short term.
Volatility Indicators:
- Bollinger Bands (BB): The stock price is currently trading near the upper Bollinger Band, indicating a potential overbought condition. This could lead to a short-term pullback or consolidation.
- Bollinger %B (BBP): The %B value is above 0.8, indicating that the stock is trading at the upper end of its recent price range.
Volume Indicators:
- On-Balance Volume (OBV): The OBV has been relatively flat over the past 5 days, suggesting a balance between buying and selling pressure. This could indicate a period of consolidation.
- Chaikin Money Flow (CMF): The CMF(20) has been positive, indicating that money is flowing into the stock. However, the recent decline in CMF suggests a potential decrease in buying pressure.
Conclusion:
Based on the analysis of the technical indicators, the next few days for XDOC stock could see a potential pullback or consolidation. The stock is currently exhibiting signs of being overbought, as indicated by the RSI, Stochastic Oscillator, and Bollinger Bands. Traders should exercise caution and consider taking profits or waiting for a better entry point. A short-term downward correction or sideways movement is likely before the stock resumes its uptrend. It is essential to monitor the price action closely and consider risk management strategies in the current market environment.