Technical Analysis of XDSQ 2024-05-10
Overview:
In analyzing the technical indicators for XDSQ over the last 5 days, we will delve into the trend, momentum, volatility, and volume indicators to provide a comprehensive outlook on the possible stock price movement in the coming days. By examining these key indicators, we aim to offer valuable insights and predictions for informed decision-making.
Trend Analysis:
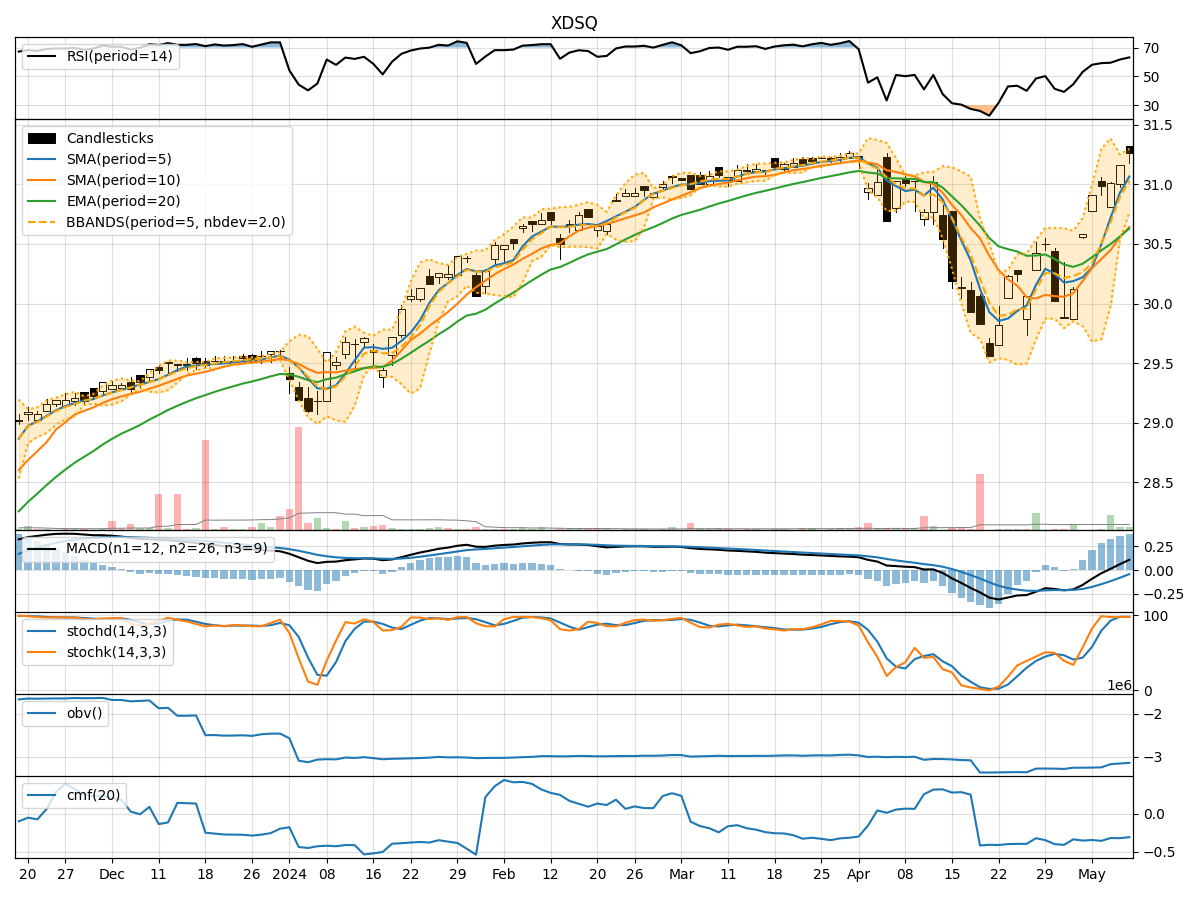
- Moving Averages (MA): The 5-day MA has been consistently above the 10-day SMA, indicating a short-term bullish trend. The EMA(20) has shown a slight upward trend, suggesting positive momentum.
- MACD: The MACD line has been above the signal line for the past 5 days, indicating bullish momentum in the stock price.
- RSI: The RSI has been gradually increasing and is currently in the overbought territory, suggesting a strong bullish sentiment.
Momentum Analysis:
- Stochastic Oscillator: Both %K and %D have been consistently high, indicating strong buying pressure and potential overbought conditions.
- Williams %R: The Williams %R has been fluctuating around the oversold territory, suggesting potential for a reversal in the short term.
Volatility Analysis:
- Bollinger Bands (BB): The stock price has been trading within the upper Bollinger Band, indicating increased volatility and potential for a breakout.
- BB% (Bollinger Band %B): The %B has been fluctuating around 0.8-0.9, indicating a relatively high price compared to the upper band.
Volume Analysis:
- On-Balance Volume (OBV): The OBV has shown a slight decrease over the last 5 days, indicating some distribution happening in the stock.
- Chaikin Money Flow (CMF): The CMF has been negative, suggesting outflow of money from the stock.
Key Observations:
- The trend indicators suggest a bullish sentiment with positive moving averages and MACD signals.
- Momentum indicators indicate potential overbought conditions, which may lead to a short-term correction.
- Volatility is high, as indicated by the Bollinger Bands, signaling potential price swings.
- Volume indicators show a slight decrease in OBV and negative CMF, indicating some selling pressure.
Conclusion:
Based on the analysis of the technical indicators, the next few days' possible stock price movement for XDSQ is likely to experience a short-term correction or consolidation. The stock has shown strong bullish momentum but is currently in overbought territory, coupled with high volatility and negative volume indicators. Traders should exercise caution and consider taking profits or waiting for a potential pullback before entering new positions.