Technical Analysis of XEMD 2024-05-10
Overview:
In analyzing the technical indicators for XEMD over the last 5 days, we will delve into the trend, momentum, volatility, and volume indicators to provide a comprehensive outlook on the possible stock price movement. By examining these key aspects, we aim to offer valuable insights and predictions for the upcoming days.
Trend Analysis:
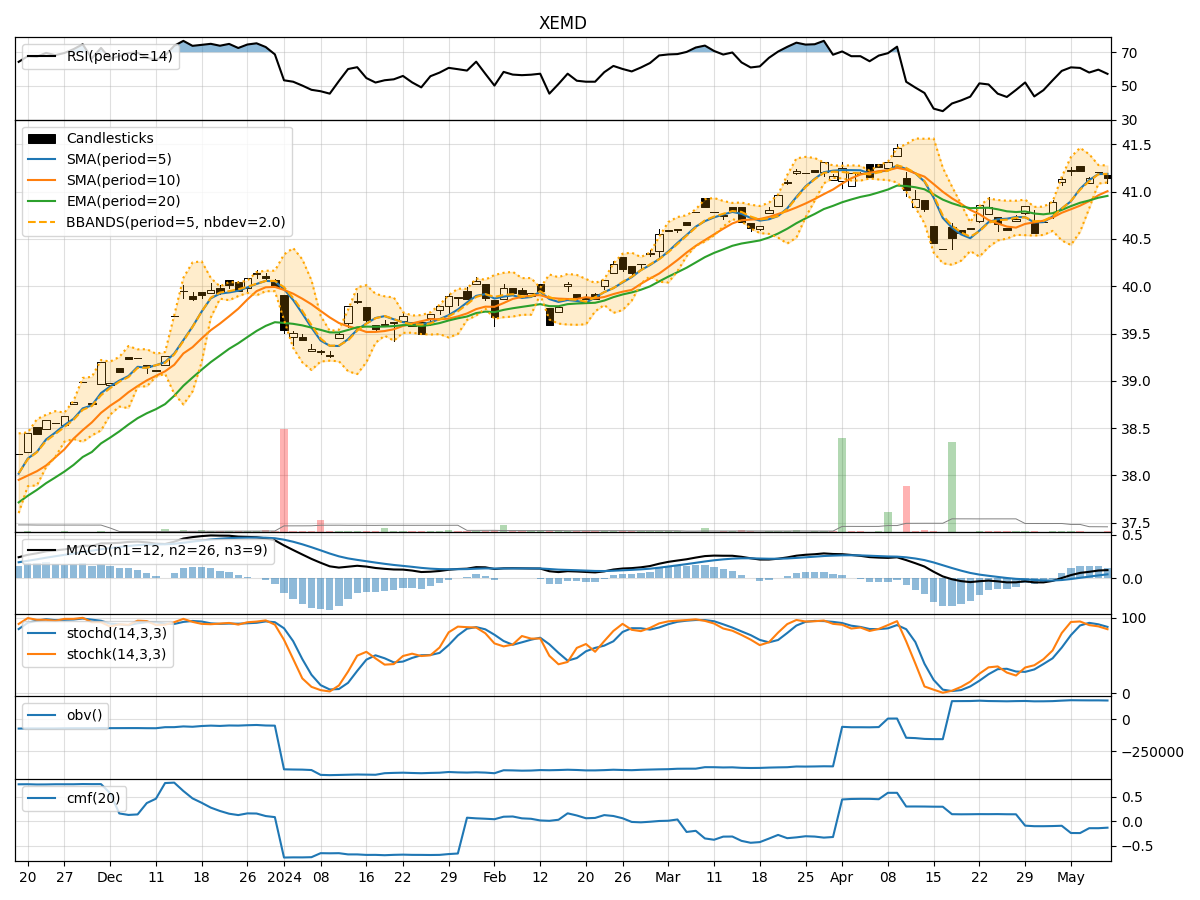
- Moving Averages (MA): The 5-day MA has been consistently above the closing price, indicating a short-term uptrend.
- MACD: The MACD line has been above the signal line, suggesting bullish momentum.
- EMA: The exponential moving average has been trending upwards, supporting the bullish sentiment.
Key Observation: The trend indicators point towards an upward trend in the stock price.
Momentum Analysis:
- RSI: The Relative Strength Index has been fluctuating around the 50 level, indicating a neutral momentum.
- Stochastic Oscillator: Both %K and %D have been declining, signaling a potential reversal in momentum.
- Williams %R: The indicator has been in oversold territory, suggesting a possible buying opportunity.
Key Observation: The momentum indicators reflect a neutral to slightly bearish sentiment.
Volatility Analysis:
- Bollinger Bands: The bands have been narrowing, indicating decreasing volatility.
- Bollinger %B: The %B indicator has been hovering around the midline, suggesting a balanced market sentiment.
Key Observation: Volatility is decreasing, potentially leading to a period of consolidation.
Volume Analysis:
- On-Balance Volume (OBV): The OBV has been relatively stable, indicating a balance between buying and selling pressure.
- Chaikin Money Flow (CMF): The CMF has been negative, suggesting outflows from the stock.
Key Observation: Volume indicators suggest a neutral stance with a slight inclination towards selling pressure.
Conclusion:
Based on the analysis of the technical indicators, the next few days' possible stock price movement for XEMD is likely to be sideways with a slight bearish bias. While the trend indicators point towards an upward trajectory, the momentum indicators signal a neutral to bearish momentum. The decreasing volatility indicates a potential consolidation phase, supported by the volume indicators showing a balance between buying and selling pressure.
Key Conclusion: The overall outlook suggests a sideways movement with a slight bearish bias in the upcoming days for XEMD. Investors should closely monitor key support and resistance levels for potential trading opportunities.