Technical Analysis of XHB 2024-05-10
Overview:
In analyzing the technical indicators for XHB over the last 5 days, we will delve into the trend, momentum, volatility, and volume indicators to provide a comprehensive outlook on the possible stock price movement. By examining these key aspects, we aim to offer valuable insights and predictions for the upcoming days.
Trend Analysis:
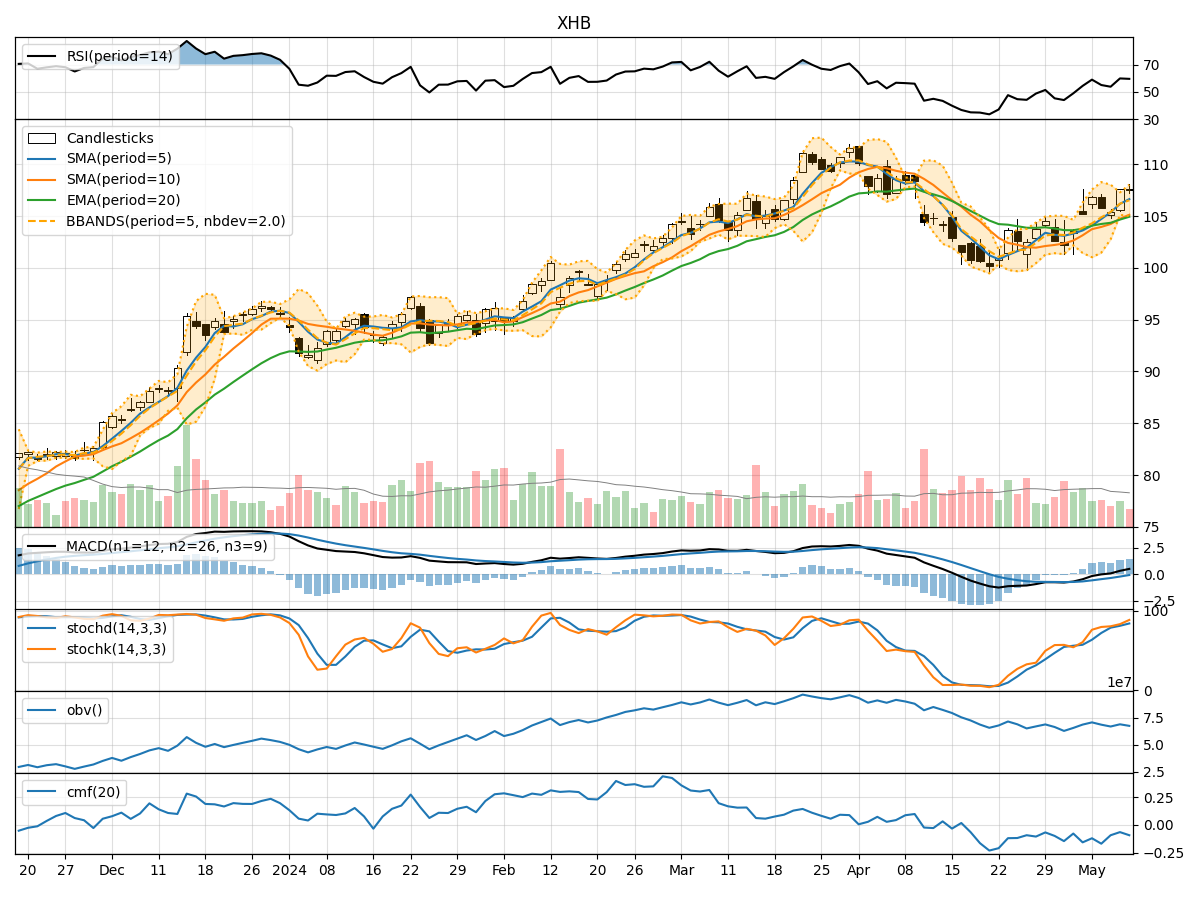
- Moving Averages (MA): The 5-day Moving Average (MA) has been consistently above the Simple Moving Average (SMA) and Exponential Moving Average (EMA), indicating a bullish trend.
- MACD: The MACD line has been above the signal line, with both lines showing an upward trend, suggesting bullish momentum.
- Conclusion: The trend indicators point towards an upward trajectory for XHB.
Momentum Analysis:
- RSI: The Relative Strength Index (RSI) has been fluctuating around the 50 level, indicating a neutral momentum.
- Stochastic Oscillator: Both %K and %D have been in the overbought zone, suggesting a potential reversal.
- Conclusion: The momentum indicators suggest a neutral to slightly bearish outlook for XHB.
Volatility Analysis:
- Bollinger Bands (BB): The price has been trading within the bands, with the bands narrowing, indicating decreasing volatility.
- Conclusion: Volatility is decreasing, signaling a potential consolidation phase for XHB.
Volume Analysis:
- On-Balance Volume (OBV): The OBV has been fluctuating, indicating indecision among investors.
- Chaikin Money Flow (CMF): The CMF has been negative, suggesting selling pressure.
- Conclusion: Volume indicators reflect mixed sentiment among investors.
Overall Conclusion:
Based on the analysis of trend, momentum, volatility, and volume indicators, the next few days for XHB are likely to see upward price movement in the short term due to the bullish trend indicated by moving averages and MACD. However, the neutral to slightly bearish momentum and mixed volume indicators suggest a potential consolidation phase or a minor pullback before resuming the upward trend.
Recommendation:
- Short-term Traders: Consider taking profits or tightening stop-loss levels as the stock may experience a temporary pullback.
- Long-term Investors: Hold positions with a focus on the bullish trend but remain vigilant for any signs of a trend reversal.
Key Takeaways:
- Upward Trend: Bullish trend indicated by moving averages and MACD.
- Neutral Momentum: RSI and Stochastic Oscillator suggest a neutral to slightly bearish momentum.
- Decreasing Volatility: Bollinger Bands narrowing signal a potential consolidation phase.
- Mixed Volume: OBV and CMF reflect mixed sentiment among investors.
Disclaimer:
Remember that market conditions can change rapidly, and it is essential to monitor the stock closely for any shifts in the technical indicators. Always consider using risk management strategies and consult with a financial advisor before making any investment decisions.