Technical Analysis of XHLF 2024-05-10
Overview:
In analyzing the technical indicators for XHLF over the last 5 days, we will delve into the trend, momentum, volatility, and volume indicators to provide a comprehensive outlook on the possible stock price movement in the coming days. By examining these key aspects, we aim to offer valuable insights and predictions for potential investors.
Trend Indicators:
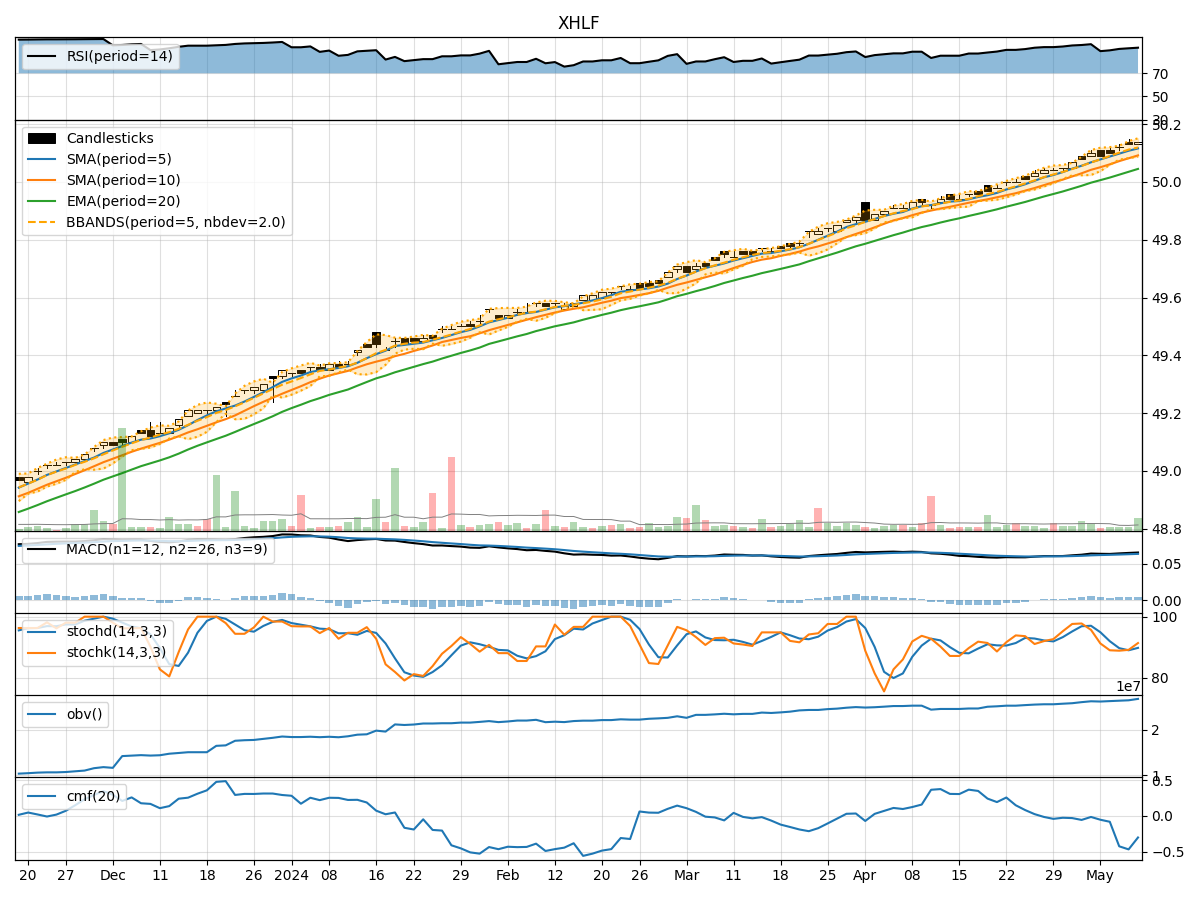
- Moving Averages (MA): The 5-day moving average has been consistently above the simple moving average (SMA) and exponential moving average (EMA), indicating a bullish trend.
- MACD: The MACD line has been consistently above the signal line, suggesting positive momentum in the stock price.
Momentum Indicators:
- RSI: The Relative Strength Index (RSI) has been consistently above 70, indicating overbought conditions but also strong bullish momentum.
- Stochastic Oscillator: Both %K and %D have been in the overbought zone, suggesting a strong upward momentum.
Volatility Indicators:
- Bollinger Bands: The stock price has been consistently trading above the middle Bollinger Band, indicating an upward trend with increased volatility.
Volume Indicators:
- On-Balance Volume (OBV): The OBV has been steadily increasing, indicating strong buying pressure in the stock.
- Chaikin Money Flow (CMF): The CMF has been negative, suggesting some distribution in the stock.
Key Observations and Opinions:
- Trend: The trend indicators suggest a strong bullish trend in XHLF.
- Momentum: The momentum indicators indicate strong buying pressure and bullish momentum in the stock.
- Volatility: The volatility indicators show an increase in volatility, which could lead to larger price swings.
- Volume: The volume indicators point towards increasing buying pressure despite some distribution indicated by CMF.
Conclusion:
Based on the analysis of the technical indicators, it is highly likely that XHLF will continue its upward trajectory in the coming days. The strong bullish trend, positive momentum, increasing buying pressure, and volatility suggest that the stock price is poised for further upward movement. Investors may consider buying or holding positions in XHLF to capitalize on the expected price appreciation.