Technical Analysis of XHYC 2024-05-10
Overview:
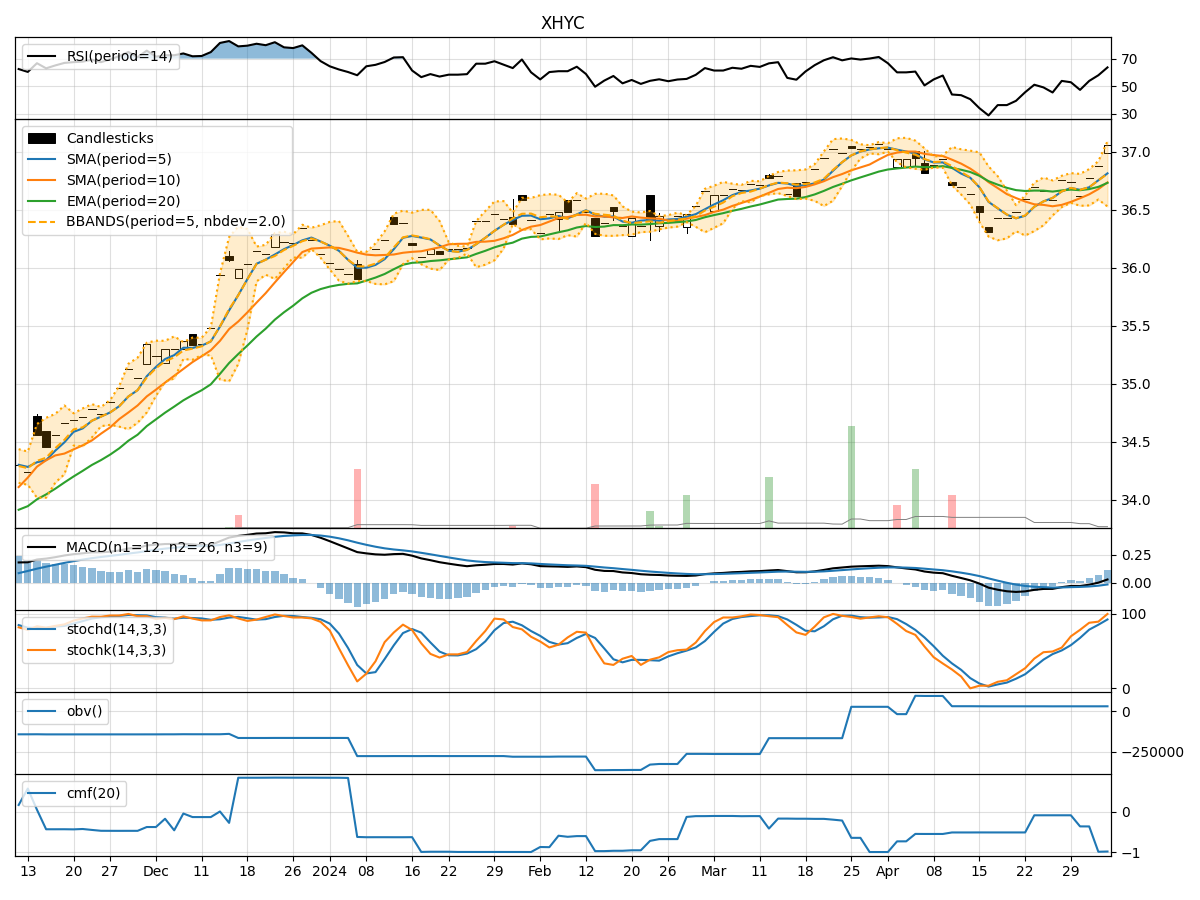
In analyzing the technical indicators for XHYC stock over the last 5 days, we will delve into the trends, momentum, volatility, and volume aspects to provide a comprehensive outlook on the possible future stock price movement. By examining key indicators such as moving averages, MACD, RSI, Bollinger Bands, and OBV, we aim to offer valuable insights and predictions for the upcoming trading days.
Trend Analysis:
- Moving Averages (MA): The 5-day MA has been consistently above the closing prices, indicating a short-term uptrend.
- MACD: The MACD line has been above the signal line, suggesting bullish momentum.
- EMA: The EMA has been trending upwards, supporting the bullish sentiment.
Key Observation: The trend indicators point towards an upward trajectory for XHYC stock.
Momentum Analysis:
- RSI: The RSI has been fluctuating around the 60-70 range, indicating moderate buying pressure.
- Stochastic Oscillator: The Stochastics show a slight decline but remain in the overbought territory.
- Williams %R: The Williams %R has been moving towards oversold levels.
Key Observation: Momentum indicators suggest a neutral to slightly bearish sentiment in the short term.
Volatility Analysis:
- Bollinger Bands: The stock price has been trading within the bands, with the upper band acting as resistance.
- Bollinger %B: The %B indicator shows the stock is currently trading close to the lower band.
Key Observation: Volatility indicators signal a sideways to slightly bearish outlook.
Volume Analysis:
- On-Balance Volume (OBV): The OBV has been relatively flat, indicating a balance between buying and selling pressure.
- Chaikin Money Flow (CMF): The CMF has been hovering around zero, reflecting a lack of strong buying or selling momentum.
Key Observation: Volume indicators suggest a neutral stance in terms of market participation.
Conclusion:
Based on the analysis of trend, momentum, volatility, and volume indicators, the overall outlook for XHYC stock in the next few days is as follows: - Trend: Upward - Momentum: Neutral to slightly bearish - Volatility: Sideways to slightly bearish - Volume: Neutral
Final Verdict:
Considering the mixed signals from different indicators, it is likely that XHYC stock may experience consolidation or sideways movement in the near term. Traders should exercise caution and closely monitor key support and resistance levels for potential trading opportunities.