Technical Analysis of XHYD 2024-05-10
Overview:
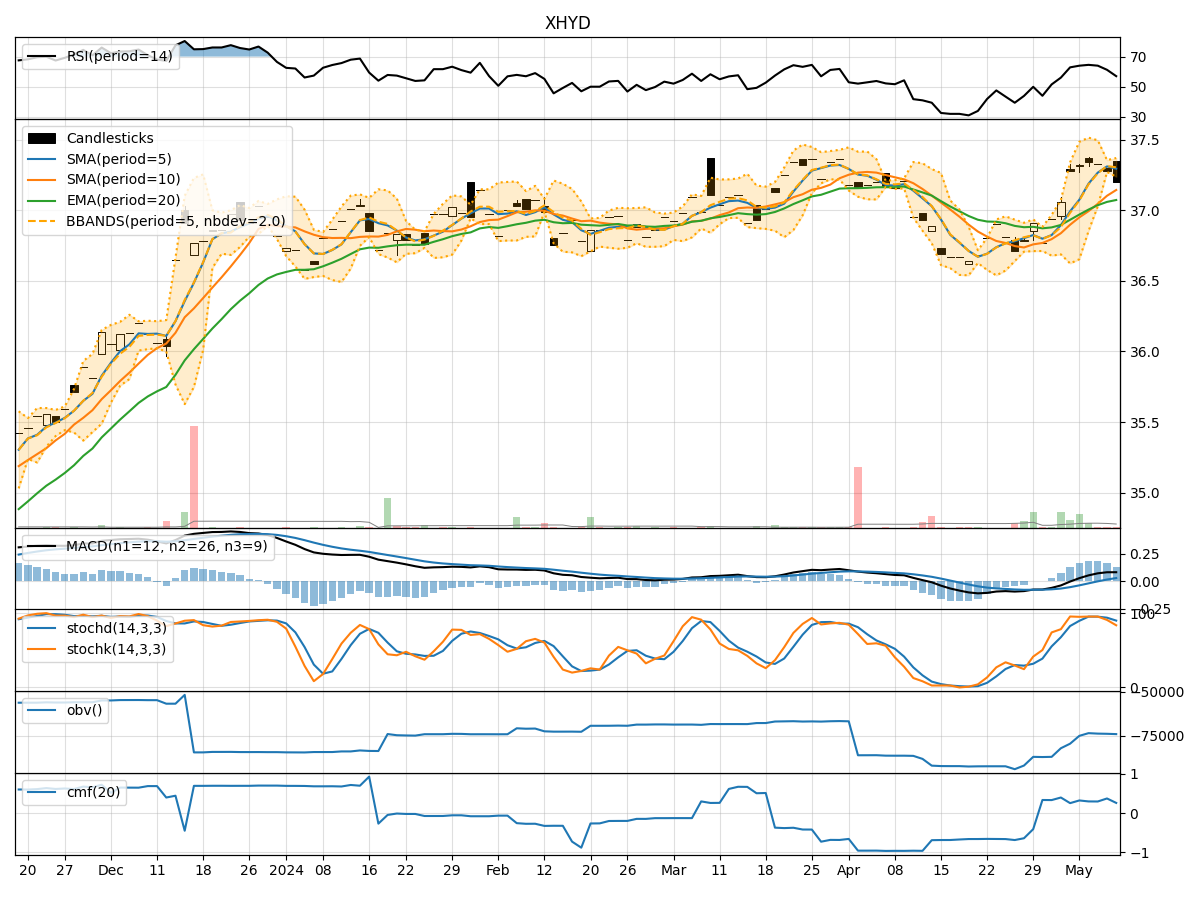
In analyzing the technical indicators for XHYD over the last 5 days, we will delve into the trend, momentum, volatility, and volume indicators to provide a comprehensive assessment of the stock's potential price movement. By examining these key factors, we aim to offer valuable insights and predictions for the next few days.
Trend Analysis:
- Moving Averages (MA): The 5-day MA has been consistently above the closing prices, indicating a short-term uptrend.
- MACD: The MACD line has been above the signal line, suggesting bullish momentum.
- RSI: The RSI has been fluctuating around the 50 level, indicating a neutral stance.
Momentum Analysis:
- Stochastic Oscillator: The Stochastic indicators have been in overbought territory, signaling a potential reversal.
- Williams %R: The Williams %R has been in oversold territory, indicating a possible buying opportunity.
Volatility Analysis:
- Bollinger Bands: The stock price has been trading within the Bollinger Bands, suggesting a period of consolidation.
- Volatility: The volatility has been relatively low, indicating a lack of significant price fluctuations.
Volume Analysis:
- On-Balance Volume (OBV): The OBV has been declining, suggesting selling pressure.
- Chaikin Money Flow (CMF): The CMF has been positive, indicating buying interest.
Conclusion:
Based on the analysis of the technical indicators, the stock is likely to experience sideways movement in the next few days. The trend indicators suggest a neutral to slightly bullish bias, while the momentum indicators point towards a potential reversal from overbought levels. The volatility indicators indicate a period of consolidation, and the volume indicators show a mixed sentiment with selling pressure but positive CMF.
In conclusion, while the stock may see some fluctuations, the overall outlook suggests a sideways trend with a slight bullish bias. Traders should closely monitor key support and resistance levels for potential entry and exit points.