Technical Analysis of XHYT 2024-05-10
Overview:
In analyzing the technical indicators for XHYT over the last 5 days, we will delve into the trend, momentum, volatility, and volume indicators to provide a comprehensive outlook on the possible stock price movement in the coming days. By examining these key aspects, we aim to offer valuable insights and recommendations for potential investors.
Trend Analysis:
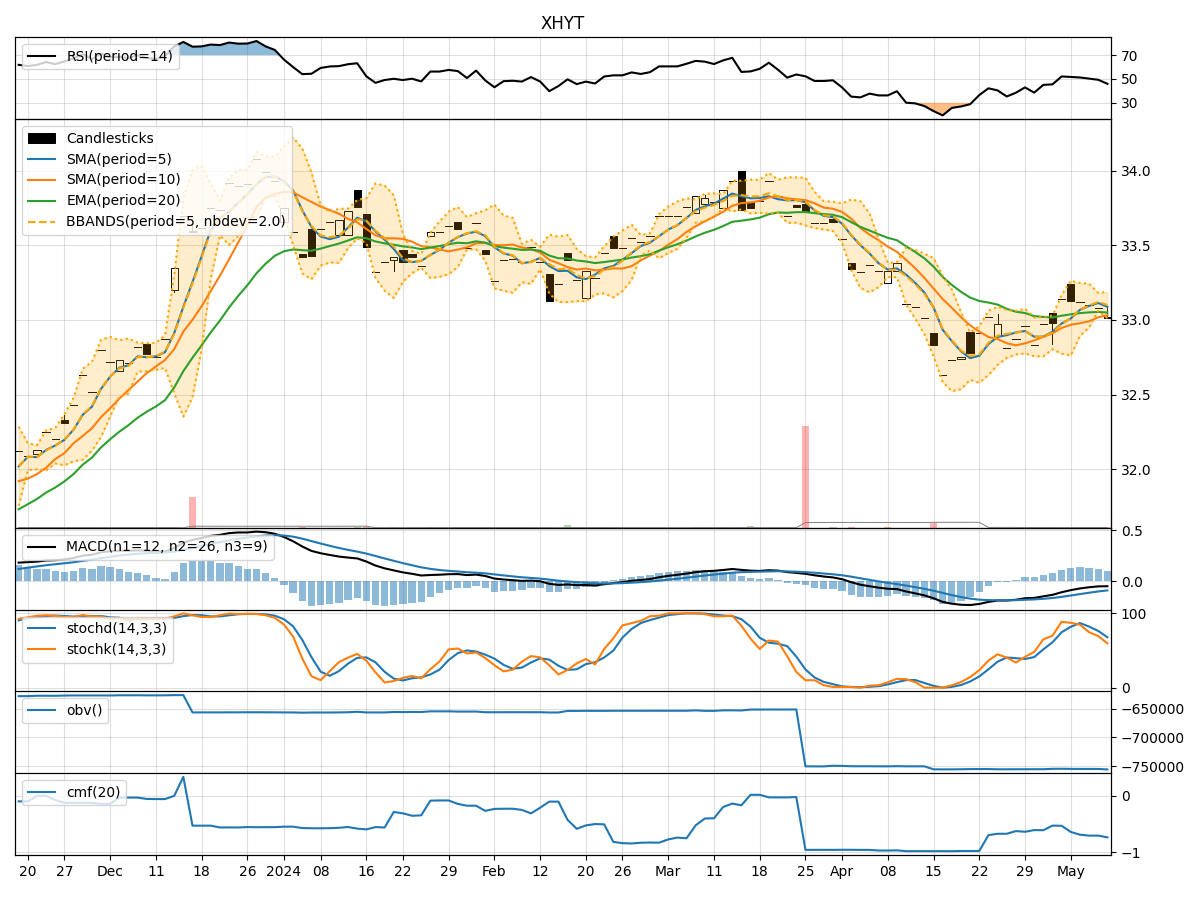
- Moving Averages (MA): The 5-day MA has been relatively stable around the closing prices, indicating a short-term trend. The SMA(10) and EMA(20) have shown slight upward movements, suggesting a potential bullish sentiment.
- MACD and Signal Line: The MACD has been consistently negative, but the gap between the MACD and signal line is narrowing, indicating a possible trend reversal.
Momentum Analysis:
- RSI: The RSI has been gradually decreasing, indicating a weakening momentum in the stock price.
- Stochastic Oscillator: Both %K and %D have been declining, suggesting a bearish momentum.
Volatility Analysis:
- Bollinger Bands (BB): The stock price has been trading within the bands, with the bands narrowing, indicating decreasing volatility.
Volume Analysis:
- On-Balance Volume (OBV): The OBV has been consistently negative, suggesting selling pressure in the stock.
- Chaikin Money Flow (CMF): The CMF has been negative, indicating a lack of buying interest.
Key Observations:
- The trend indicators show a potential bullish sentiment in the short term.
- Momentum indicators suggest a weakening momentum and a bearish outlook.
- Volatility is decreasing, indicating a possible consolidation phase.
- Volume indicators point towards selling pressure and a lack of buying interest.
Conclusion:
Based on the analysis of the technical indicators, the next few days' possible stock price movement for XHYT is likely to be sideways with a slight bearish bias. The trend indicators hint at a potential bullish sentiment, but the momentum, volume, and volatility indicators suggest a more cautious approach. Investors should closely monitor the price action and key support levels for any potential trend reversal.