Technical Analysis of XJAN 2024-05-10
Overview:
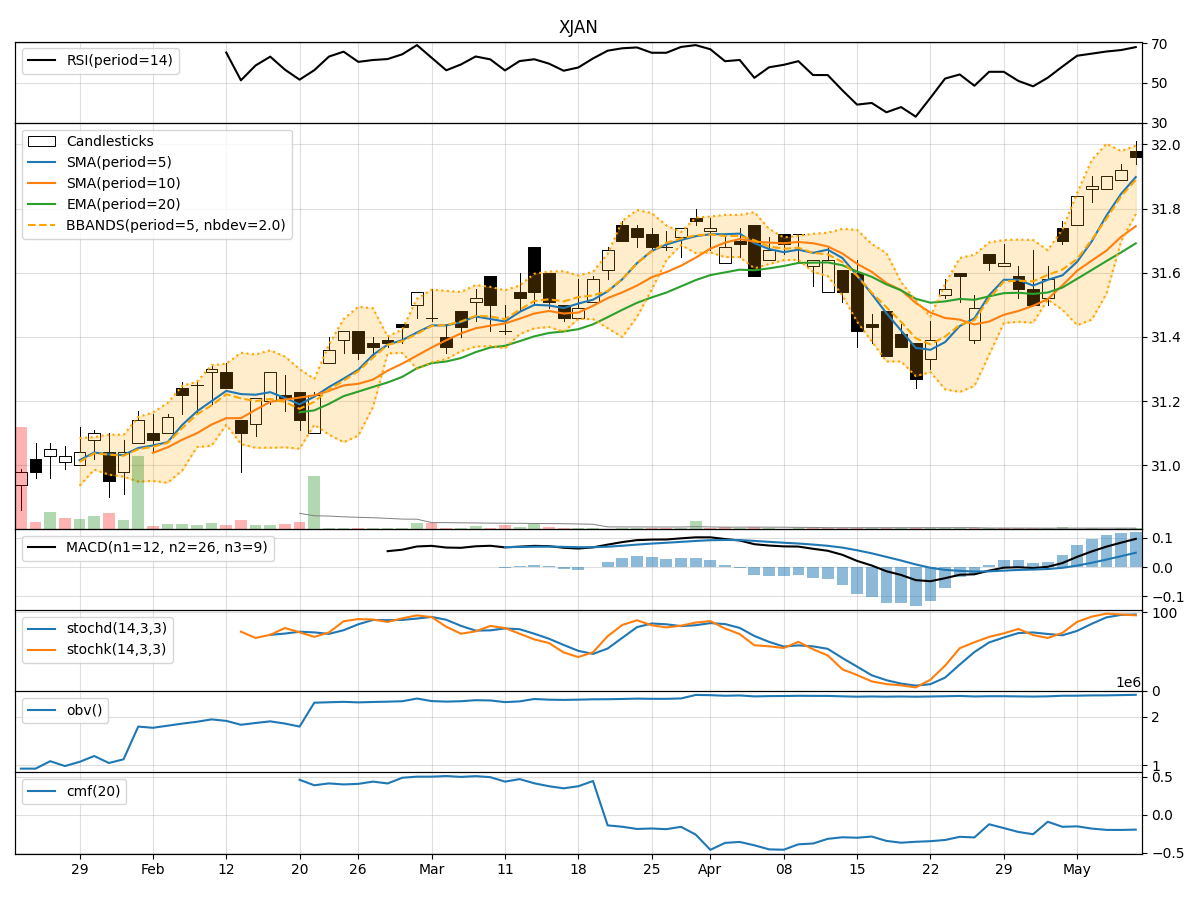
In analyzing the technical indicators for XJAN stock over the last 5 days, we will delve into the trends, momentum, volatility, and volume indicators to provide a comprehensive outlook on the possible stock price movement in the coming days. By examining key metrics such as moving averages, MACD, RSI, Bollinger Bands, and OBV, we aim to offer valuable insights and predictions for potential price action.
Trend Indicators:
- Moving Averages (MA): The 5-day MA has been consistently above the closing price, indicating a short-term uptrend.
- MACD: The MACD line has been steadily increasing, with the MACD histogram showing positive values, suggesting bullish momentum.
- EMA: The EMA has been trending upwards, reflecting a positive price trend.
Momentum Indicators:
- RSI: The RSI has been gradually increasing and is in the overbought territory, signaling potential strength in the current uptrend.
- Stochastic Oscillator: Both %K and %D lines are high, indicating strong buying pressure.
- Williams %R: The indicator is in the oversold region, suggesting a potential reversal or consolidation.
Volatility Indicators:
- Bollinger Bands: The price has been trading within the bands, with the bands narrowing, indicating reduced volatility.
- Bollinger %B: The %B is above 0.5, suggesting a bullish sentiment in the market.
Volume Indicators:
- On-Balance Volume (OBV): The OBV has been slightly declining, indicating some distribution happening in the stock.
- Chaikin Money Flow (CMF): The CMF is negative, suggesting outflow of money from the stock.
Key Observations and Opinions:
- Trend: The stock is in an upward trend based on moving averages and MACD.
- Momentum: Momentum indicators suggest strong buying pressure and potential overbought conditions.
- Volatility: Volatility is decreasing, indicating a possible period of consolidation.
- Volume: The OBV shows slight distribution while CMF indicates negative money flow.
Conclusion:
Based on the analysis of technical indicators, the next few days for XJAN stock are likely to see continued upward movement with potential for consolidation due to decreasing volatility. The strong buying pressure indicated by momentum indicators may drive the price higher, but caution is advised due to the overbought conditions. Traders should monitor for any signs of reversal or distribution in volume indicators to make informed decisions.