Technical Analysis of XJH 2024-05-10
Overview:
In analyzing the technical indicators for XJH stock over the last 5 days, we will delve into the trends, momentum, volatility, and volume aspects to provide a comprehensive outlook on the possible stock price movement in the coming days. By examining key indicators such as moving averages, MACD, RSI, Bollinger Bands, and OBV, we aim to offer valuable insights and predictions for informed decision-making.
Trend Analysis:
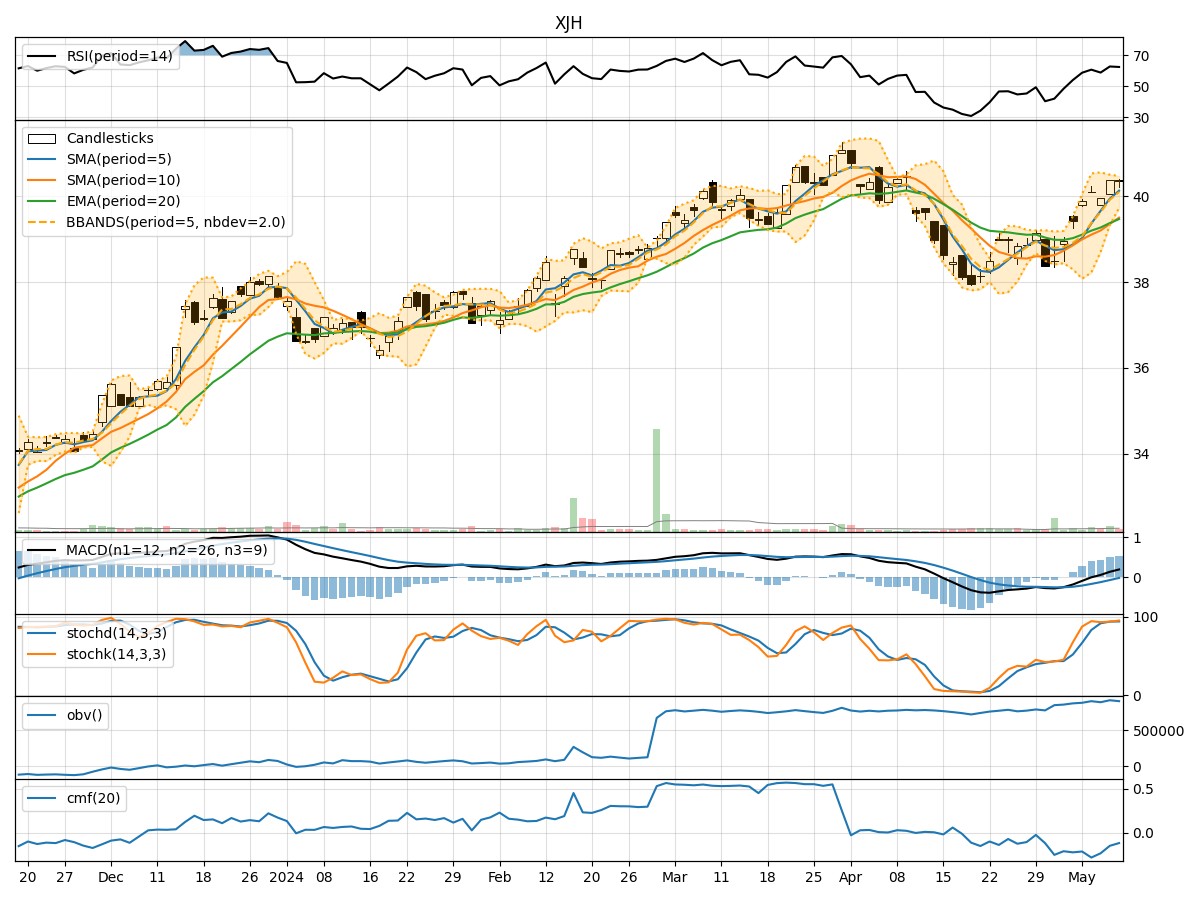
- Moving Averages (MA): The 5-day MA has been consistently trending upwards, indicating a positive momentum in the short term.
- MACD: The MACD line has been above the signal line, suggesting a bullish trend.
- EMA: The EMA has been steadily increasing, supporting the bullish sentiment in the market.
Momentum Analysis:
- RSI: The RSI has been in the overbought territory, indicating a strong buying momentum.
- Stochastic Oscillator: Both %K and %D have been in the overbought zone, signaling a potential reversal or consolidation.
- Williams %R: The indicator has been in the oversold region, suggesting a possible buying opportunity.
Volatility Analysis:
- Bollinger Bands: The stock price has been trading within the bands, indicating a period of consolidation.
- Bollinger %B: The %B value has been fluctuating around 0.8, suggesting a balanced volatility level.
Volume Analysis:
- On-Balance Volume (OBV): The OBV has been fluctuating, indicating mixed buying and selling pressure.
- Chaikin Money Flow (CMF): The CMF has been negative, reflecting a bearish sentiment in the market.
Key Observations:
- The stock is currently in a bullish trend based on moving averages and MACD.
- Momentum indicators like RSI and Stochastic Oscillator suggest a strong buying momentum but also hint at a potential reversal due to overbought conditions.
- Volatility is relatively low, as indicated by Bollinger Bands, signaling a period of consolidation.
- Volume indicators show mixed signals, with OBV fluctuating and CMF reflecting a bearish sentiment.
Conclusion:
Based on the analysis of technical indicators, the next few days for XJH stock are likely to see further upward movement in price, supported by the bullish trend and positive momentum. However, caution is advised as overbought conditions and mixed volume signals could lead to a potential reversal or consolidation in the near term. Traders should closely monitor key levels and wait for confirmation before making significant trading decisions.