Technical Analysis of XJR 2024-05-10
Overview:
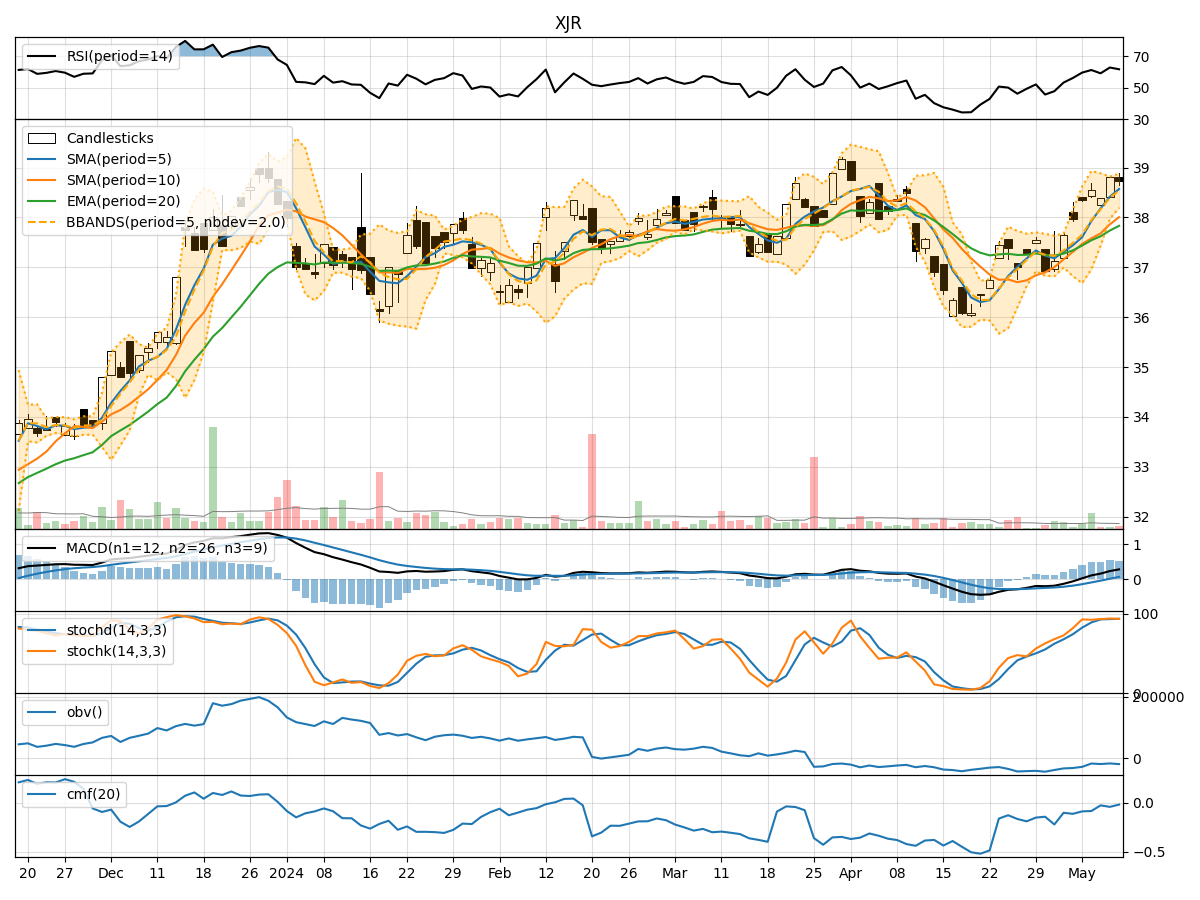
In the last 5 trading days, XJR stock has shown a consistent uptrend in its price, with increasing volumes. The moving averages indicate a positive trend, supported by the MACD and momentum indicators. Volatility has been relatively stable, and volume indicators suggest a slight decrease in buying pressure.
Trend Analysis:
- Moving Averages (MA): The 5-day MA has been consistently above the 10-day SMA, indicating a short-term bullish trend. The EMA(20) has also been trending upwards, supporting the bullish sentiment.
- MACD: The MACD line has been above the signal line for the past 5 days, indicating a bullish momentum in the stock price.
Key Observation: The trend indicators suggest a strong bullish sentiment in the stock price.
Momentum Analysis:
- RSI: The RSI has been consistently above 50, indicating bullish momentum in the stock.
- Stochastic Oscillator: Both %K and %D have been in the overbought zone, suggesting a strong bullish momentum.
- Williams %R: The Williams %R has been consistently in the oversold territory, indicating a potential reversal in the stock price.
Key Observation: Momentum indicators support the bullish sentiment in the stock price.
Volatility Analysis:
- Bollinger Bands: The stock price has been trading within the upper Bollinger Band, indicating a potential overbought condition.
Key Observation: Volatility indicators suggest a potential consolidation or pullback in the stock price.
Volume Analysis:
- On-Balance Volume (OBV): The OBV has been slightly decreasing over the last 5 days, indicating a decrease in buying pressure.
- Chaikin Money Flow (CMF): The CMF has been negative, suggesting a slight bearish pressure in the stock.
Key Observation: Volume indicators indicate a slight decrease in buying pressure.
Conclusion:
Based on the technical analysis of XJR stock: - Trend: The stock is in a strong upward trend. - Momentum: Momentum indicators support a bullish view. - Volatility: Volatility indicators suggest a potential consolidation or pullback. - Volume: Volume indicators show a slight decrease in buying pressure.
Recommendation:
Considering the overall analysis, the next few days may see a continuation of the bullish trend in XJR stock, but with a possibility of a consolidation or pullback due to the overbought conditions indicated by the volatility indicators. Traders should closely monitor the price action and key support levels for potential entry or exit points.