Technical Analysis of XLC 2024-05-10
Overview:
In analyzing the technical indicators for XLC over the last 5 days, we will delve into the trend, momentum, volatility, and volume indicators to provide a comprehensive outlook on the possible stock price movement. By examining these key aspects, we aim to offer valuable insights and predictions for the upcoming days.
Trend Analysis:
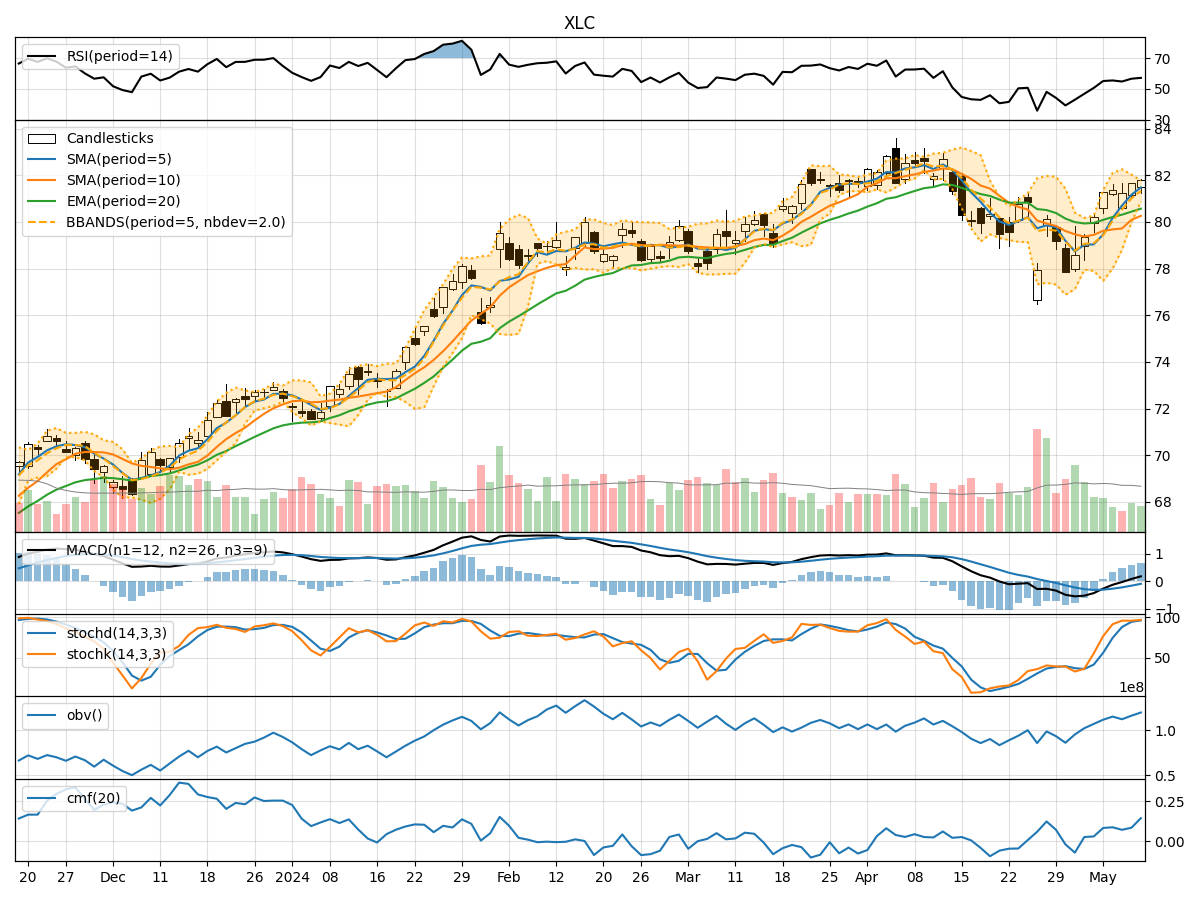
- Moving Averages (MA): The 5-day Moving Average (MA) has been consistently above the Simple Moving Average (SMA) and Exponential Moving Average (EMA), indicating a bullish trend.
- MACD: The MACD line has been consistently above the signal line, with the MACD Histogram showing an increasing positive trend, suggesting bullish momentum.
Momentum Analysis:
- RSI: The Relative Strength Index (RSI) has been fluctuating around the mid-level, indicating a neutral momentum.
- Stochastic Oscillator: Both %K and %D have been in the overbought zone, suggesting a potential reversal or consolidation.
- Williams %R: The Williams %R is hovering around the oversold territory, indicating a possible bullish reversal.
Volatility Analysis:
- Bollinger Bands (BB): The price has been trading within the Bollinger Bands, with the bands narrowing, indicating decreasing volatility.
Volume Analysis:
- On-Balance Volume (OBV): The OBV has shown mixed signals, with fluctuations in volume accumulation.
- Chaikin Money Flow (CMF): The CMF has been positive, indicating buying pressure in the market.
Key Observations:
- The trend indicators suggest a bullish sentiment, supported by the MACD and moving averages.
- Momentum indicators show a mixed picture, with RSI neutral, Stochastic in overbought territory, and Williams %R indicating a potential bullish reversal.
- Volatility has been decreasing, as seen in the narrowing Bollinger Bands.
- Volume indicators show mixed signals, with OBV fluctuating and CMF indicating buying pressure.
Conclusion:
Based on the analysis of technical indicators, the next few days' possible stock price movement for XLC is likely to be bullish. The trend indicators support a bullish outlook, while momentum indicators suggest a potential bullish reversal. Volatility is decreasing, which may lead to a more stable price movement. However, it is essential to monitor the Stochastic oscillator for any signs of a reversal and keep an eye on volume accumulation for confirmation of the bullish trend. Overall, the technical analysis points towards an upward movement in the stock price of XLC in the coming days.