Technical Analysis of XLP 2024-05-10
Overview:
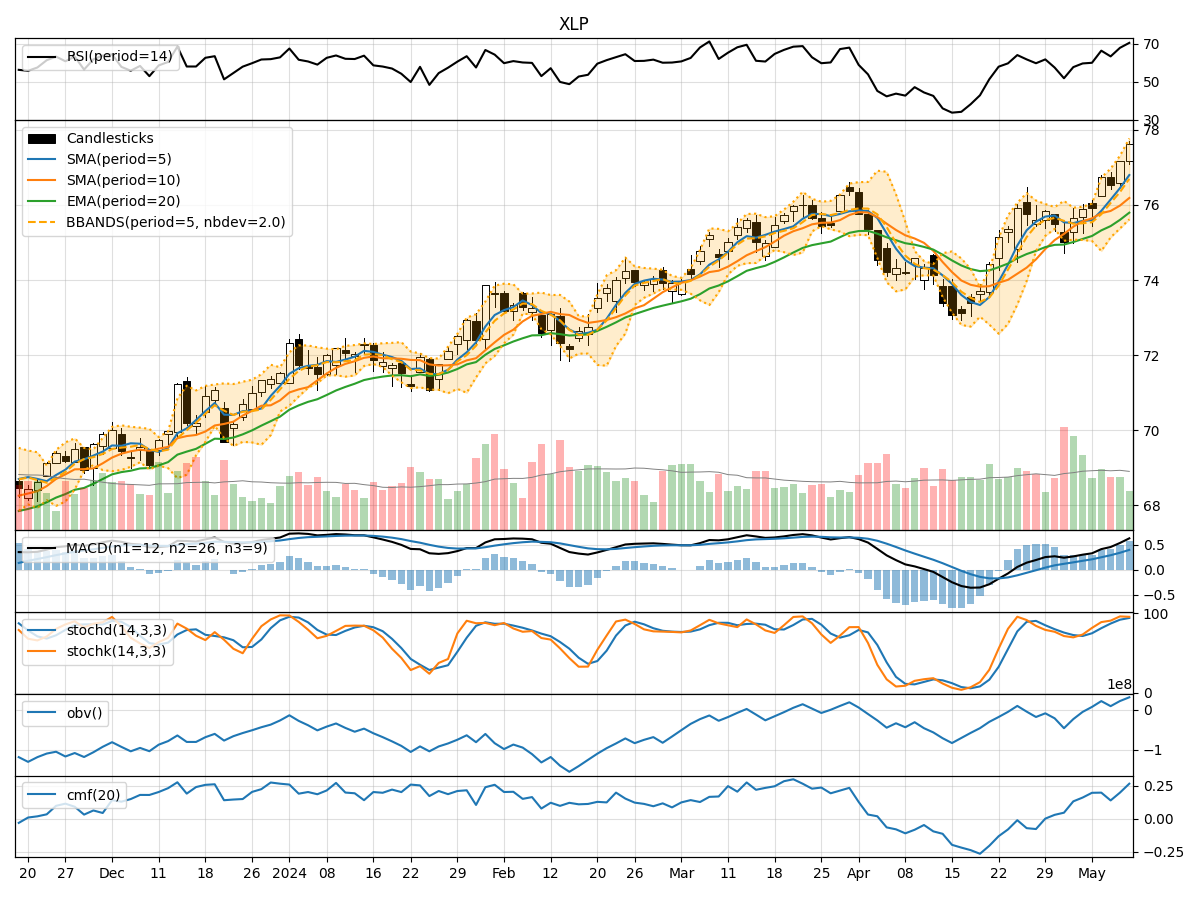
In analyzing the technical indicators for XLP over the last 5 days, we will delve into the trend, momentum, volatility, and volume indicators to provide a comprehensive outlook on the possible stock price movement. By examining these key aspects, we aim to offer valuable insights and predictions for the upcoming days.
Trend Analysis:
- Moving Averages (MA): The 5-day MA has been consistently above the closing prices, indicating a bullish trend.
- MACD: The MACD line has been trending upwards, crossing above the signal line, suggesting bullish momentum.
- RSI: The RSI values have been increasing, reflecting strengthening bullish momentum.
Key Observation: The trend indicators point towards a bullish sentiment in the market.
Momentum Analysis:
- Stochastic Oscillator: Both %K and %D values have been in the overbought territory, signaling a strong bullish momentum.
- Williams %R: The indicator has been hovering in the oversold region, indicating a potential reversal to the upside.
Key Observation: Momentum indicators suggest a strong bullish sentiment in the market.
Volatility Analysis:
- Bollinger Bands (BB): The bands have been widening, indicating increased volatility in the stock price.
- Bollinger %B: The %B values have been fluctuating, reflecting the volatility in the price movements.
Key Observation: Volatility indicators point towards increased volatility in the market.
Volume Analysis:
- On-Balance Volume (OBV): The OBV values have been increasing, indicating accumulation by investors.
- Chaikin Money Flow (CMF): The CMF values have been positive, suggesting buying pressure in the market.
Key Observation: Volume indicators suggest positive accumulation and buying pressure in the market.
Conclusion:
Based on the analysis of trend, momentum, volatility, and volume indicators, the overall outlook for XLP in the next few days is strongly bullish. The trend indicators, momentum oscillators, and volume indicators all align in signaling a continuation of the bullish trend. The increased volatility may present trading opportunities for short-term traders, but the overall bias remains bullish.
Recommendation:
Considering the comprehensive analysis of technical indicators, it is advisable to consider long positions in XLP for potential gains in the upcoming trading sessions. Traders should closely monitor the momentum indicators for any signs of potential reversals, but the overall trend favors a bullish bias.