Technical Analysis of XLSR 2024-05-10
Overview:
In analyzing the technical indicators for XLSR over the last 5 days, we will delve into the trend, momentum, volatility, and volume indicators to provide a comprehensive outlook on the possible stock price movement in the coming days.
Trend Analysis:
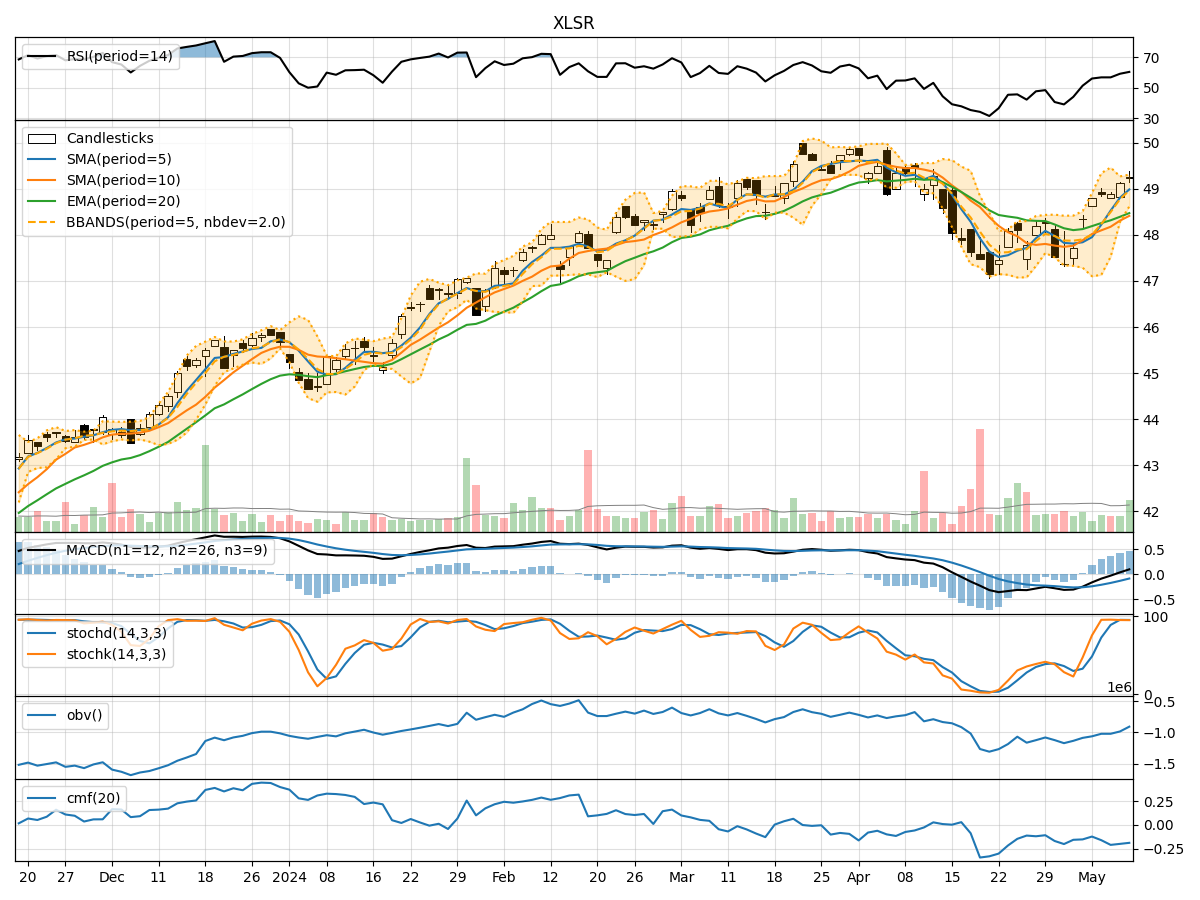
- Moving Averages (MA): The 5-day Moving Average (MA) has been trending upwards, indicating a positive momentum in the stock price.
- MACD: The MACD line has been consistently above the signal line, suggesting a bullish trend.
- RSI: The Relative Strength Index (RSI) is in the neutral zone, indicating potential for further price movement in either direction.
Momentum Analysis:
- Stochastic Oscillator: Both %K and %D values are in the overbought zone, signaling a potential reversal or consolidation.
- Williams %R: The Williams %R is in the oversold territory, indicating a possible buying opportunity.
Volatility Analysis:
- Bollinger Bands: The stock price has been trading within the Bollinger Bands, suggesting a period of consolidation.
- Volatility: The volatility has been decreasing, indicating a potential stabilization in the stock price.
Volume Analysis:
- On-Balance Volume (OBV): The OBV has been declining, suggesting a decrease in buying pressure.
- Chaikin Money Flow (CMF): The CMF is negative, indicating a bearish sentiment in the stock.
Key Observations:
- The stock is currently in a consolidation phase as indicated by the Bollinger Bands and decreasing volatility.
- Momentum indicators show conflicting signals with the Stochastic Oscillator in the overbought zone and Williams %R in the oversold territory.
- The OBV and CMF suggest a lack of strong buying interest in the stock.
Conclusion:
Based on the analysis of the technical indicators, the stock price of XLSR is likely to consolidate in the near term. The conflicting signals from momentum indicators and the lack of strong buying pressure indicated by volume indicators suggest a period of sideways movement. Traders should exercise caution and wait for clearer signals before taking any significant positions.