Technical Analysis of XMAR 2024-05-10
Overview:
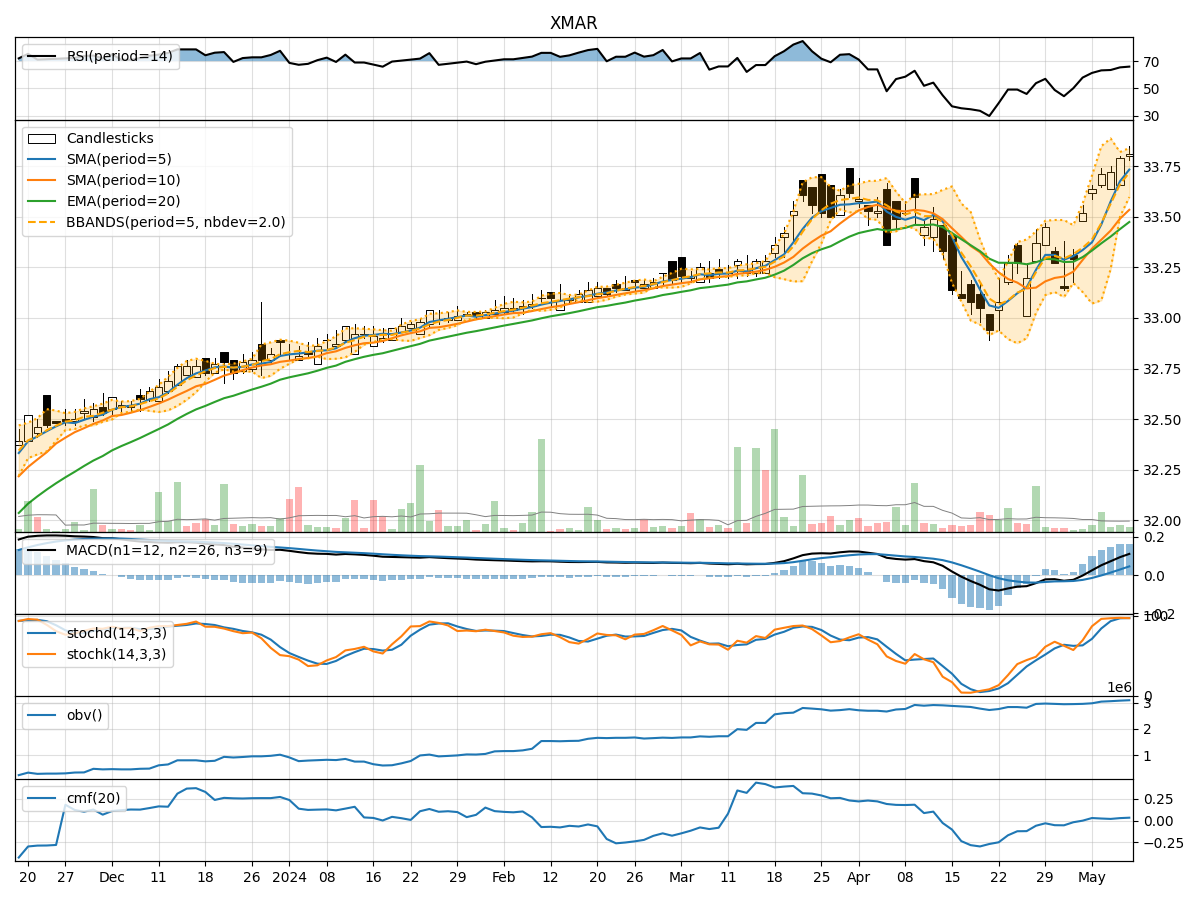
In analyzing the technical indicators for XMAR over the last 5 days, we will delve into the trend, momentum, volatility, and volume indicators to provide a comprehensive outlook on the possible stock price movement in the coming days.
Trend Analysis:
- Moving Averages (MA): The 5-day Moving Average (MA) has been consistently above the Simple Moving Average (SMA) and Exponential Moving Average (EMA), indicating a bullish trend.
- MACD: The MACD line has been consistently above the signal line, with both lines showing an upward trend, suggesting bullish momentum.
Momentum Analysis:
- RSI: The Relative Strength Index (RSI) has been in the overbought territory, indicating strong buying momentum.
- Stochastic Oscillator: Both %K and %D have been in the overbought zone, suggesting a potential reversal or consolidation.
Volatility Analysis:
- Bollinger Bands (BB): The stock price has been trading within the upper Bollinger Band, indicating an overbought condition.
Volume Analysis:
- On-Balance Volume (OBV): The OBV has been steadily increasing, reflecting positive buying pressure.
- Chaikin Money Flow (CMF): The CMF has been positive, indicating money flow into the stock.
Key Observations:
- The trend indicators suggest a strong bullish sentiment in the short term.
- Momentum indicators show overbought conditions, signaling a potential reversal or consolidation.
- Volatility indicators point towards an overbought market.
- Volume indicators reflect positive buying pressure.
Conclusion:
Based on the analysis of the technical indicators, the next few days' possible stock price movement for XMAR is likely to experience a short-term consolidation or pullback. The stock has shown strong bullish momentum but is currently in overbought territory according to the momentum and volatility indicators. Traders may consider taking profits or waiting for a better entry point before considering long positions. It is essential to monitor the price action closely for any signs of a reversal or continuation of the bullish trend.