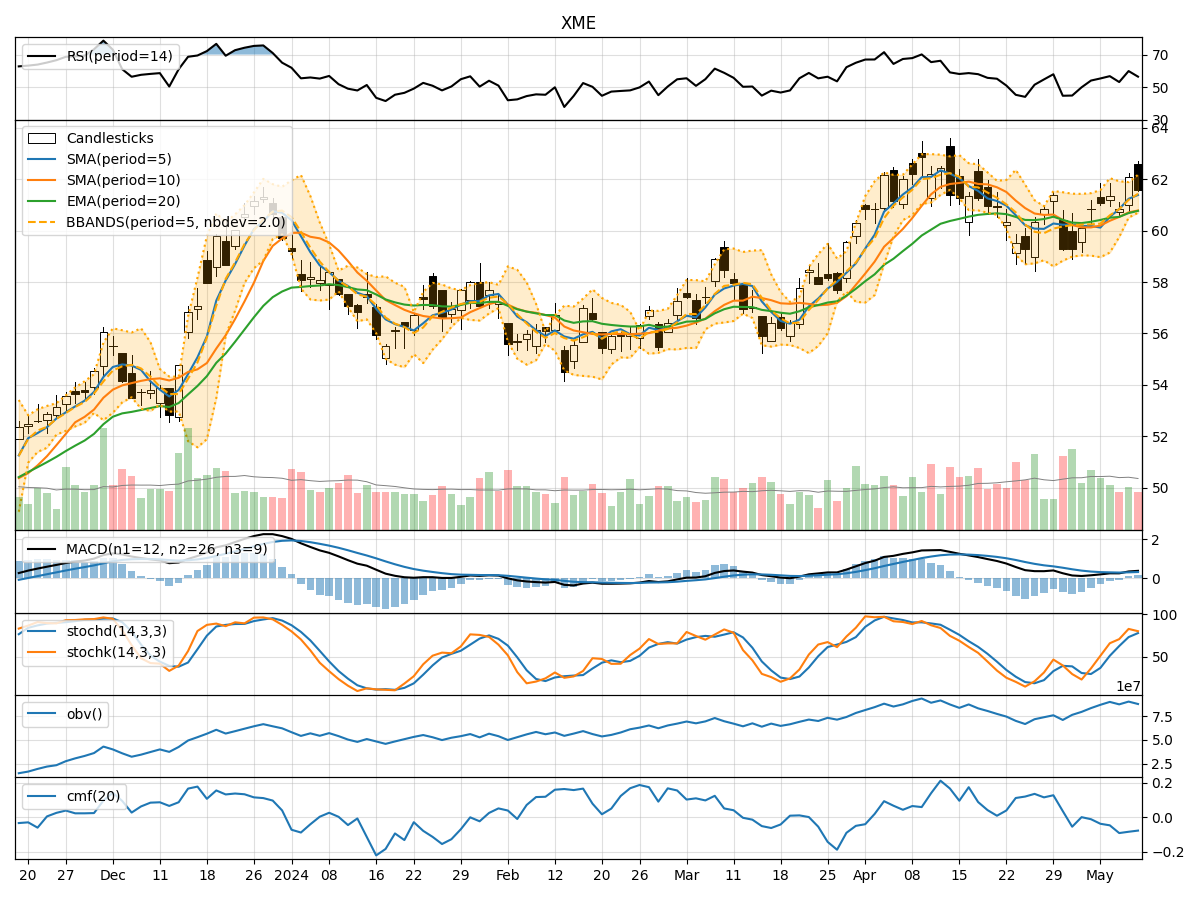
Technical Analysis of XME 2024-05-10
Overview:
In analyzing the technical indicators for XME over the last 5 days, we will delve into the trend, momentum, volatility, and volume indicators to provide a comprehensive outlook on the possible stock price movement in the coming days. By examining these key indicators, we aim to offer valuable insights and recommendations for potential investors.
Trend Analysis:
- Moving Averages (MA): The 5-day Moving Average (MA) has been consistently above the Simple Moving Average (SMA) and Exponential Moving Average (EMA) over the past 5 days, indicating a short-term uptrend.
- MACD: The MACD line has been consistently above the signal line, with both lines showing an upward trend, suggesting bullish momentum in the stock price.
- Conclusion: The trend indicators point towards an upward trend in the stock price.
Momentum Analysis:
- RSI: The Relative Strength Index (RSI) has been fluctuating around the 50 level, indicating a neutral momentum in the stock.
- Stochastic Oscillator: Both %K and %D lines of the Stochastic Oscillator have been in the overbought zone, suggesting a potential reversal in the stock price.
- Conclusion: The momentum indicators suggest a neutral to slightly bearish momentum in the stock.
Volatility Analysis:
- Bollinger Bands: The stock price has been trading within the Bollinger Bands, with the bands narrowing, indicating decreasing volatility.
- Conclusion: The volatility indicators suggest a decreasing volatility in the stock price.
Volume Analysis:
- On-Balance Volume (OBV): The OBV has been fluctuating, indicating a balance between buying and selling pressure.
- Chaikin Money Flow (CMF): The CMF has been negative, suggesting a bearish money flow in the stock.
- Conclusion: The volume indicators point towards a neutral to slightly bearish sentiment in the stock.
Overall Conclusion:
Based on the analysis of the trend, momentum, volatility, and volume indicators, the stock price is likely to continue its upward trend in the short term. However, the momentum indicators suggest a potential reversal or consolidation in the stock price. The decreasing volatility indicates a stabilization in the price movement, while the volume indicators show a neutral to slightly bearish sentiment.
Recommendation:
Considering the overall analysis, investors should exercise caution and closely monitor the stock price for any signs of a reversal or consolidation. It is advisable to set stop-loss levels to manage risk effectively. Additionally, conducting further research and analysis on fundamental factors impacting the stock can provide a more comprehensive view before making any investment decisions.