Technical Analysis of XMHQ 2024-05-10
Overview:
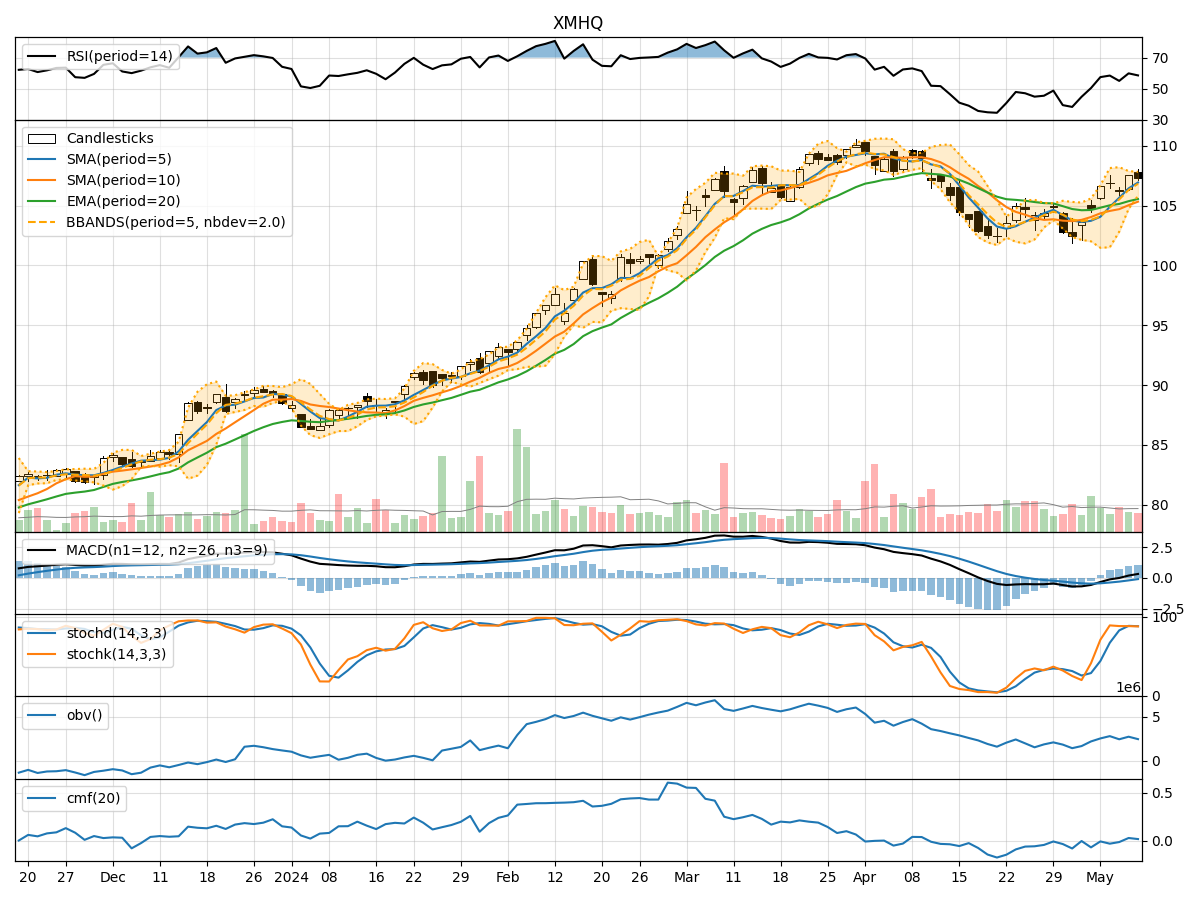
In analyzing the technical indicators for XMHQ over the last 5 days, we will delve into the trend, momentum, volatility, and volume indicators to provide a comprehensive outlook on the possible stock price movement. By examining these key aspects, we aim to offer valuable insights and predictions for the upcoming days.
Trend Indicators:
- Moving Averages (MA): The 5-day Moving Average has been consistently above the 10-day Simple Moving Average, indicating a short-term bullish trend.
- Exponential Moving Average (EMA): The EMA has been showing an upward trend, suggesting positive momentum in the stock price.
- Moving Average Convergence Divergence (MACD): The MACD line has been above the signal line, indicating a bullish signal.
- Conclusion: The trend indicators suggest an upward momentum in the stock price.
Momentum Indicators:
- Relative Strength Index (RSI): RSI has been fluctuating around the neutral level of 50, indicating a balanced momentum.
- Stochastic Oscillator: Both %K and %D have been relatively high, suggesting potential overbought conditions.
- Williams %R (Willams %R): The Williams %R has been hovering in the oversold territory, indicating a potential reversal.
- Conclusion: The momentum indicators are mixed, but there are signs of overbought conditions.
Volatility Indicators:
- Bollinger Bands (BB): The stock price has been trading within the Bollinger Bands, indicating normal volatility.
- Conclusion: Volatility remains within normal levels, suggesting stability in price movements.
Volume Indicators:
- On-Balance Volume (OBV): The OBV has been fluctuating, indicating indecision among investors.
- Chaikin Money Flow (CMF): The CMF has been negative, suggesting selling pressure.
- Conclusion: Volume indicators point towards indecisiveness in the market sentiment.
Overall Conclusion:
Based on the analysis of the technical indicators, the stock of XMHQ is likely to experience upward momentum in the near future, supported by the positive trend indicators. However, the mixed signals from momentum indicators and the indecisiveness in volume indicators suggest a potential correction or consolidation in the short term. Traders should closely monitor the price action and key support/resistance levels for better decision-making.
Recommendation:
- Short-Term: Consider taking profits if the stock price reaches overbought levels based on momentum indicators.
- Long-Term: Hold the position with a cautious approach, considering the potential for a correction in the near future.
- Risk Management: Set stop-loss orders to protect profits and mitigate potential losses in case of a sudden downturn.
By combining technical analysis with market insights, investors can make informed decisions and navigate the dynamic landscape of the stock market effectively.