Technical Analysis of XMLV 2024-05-10
Overview:
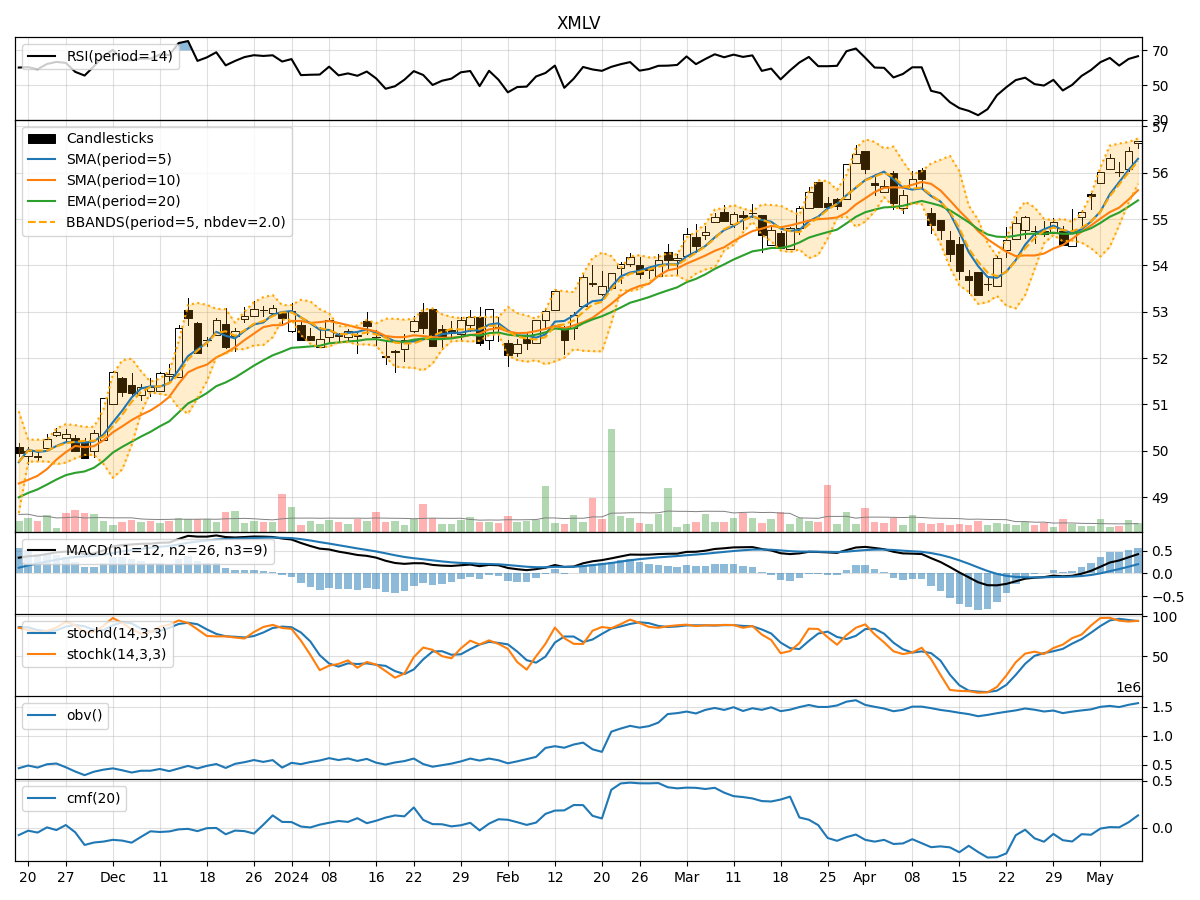
In the last 5 trading days, XMLV has shown a consistent uptrend in its stock price, supported by positive momentum and volatility indicators. The volume has also been increasing, indicating growing interest from investors. However, it is essential to delve deeper into each technical indicator category to provide a comprehensive analysis and make informed predictions for the next few days.
Trend Indicators:
- Moving Averages (MA): The 5-day Moving Average (MA) has been consistently above the Simple Moving Average (SMA) and Exponential Moving Average (EMA), indicating a bullish trend.
- MACD: The MACD line has been consistently above the signal line, with both lines showing an upward trend, suggesting continued bullish momentum.
- MACD Histogram: The MACD Histogram has been increasing, indicating strengthening bullish momentum.
Momentum Indicators:
- RSI: The Relative Strength Index (RSI) has been in the overbought territory but has not shown signs of divergence, suggesting the stock may still have room to grow.
- Stochastic Oscillator: Both %K and %D lines of the Stochastic Oscillator have been in the overbought zone, indicating strong buying pressure.
- Williams %R: The Williams %R has been fluctuating around the oversold region, suggesting potential buying opportunities.
Volatility Indicators:
- Bollinger Bands: The stock price has been trading near the upper Bollinger Band, indicating high volatility and potential overbought conditions.
- Bollinger %B: The %B indicator has been above 0.8, suggesting the stock is trading at the upper end of its recent price range.
Volume Indicators:
- On-Balance Volume (OBV): The OBV has been steadily increasing, indicating accumulation by investors.
- Chaikin Money Flow (CMF): The CMF has been positive, reflecting buying pressure in the stock.
Key Observations and Opinions:
- Trend: The trend indicators suggest a strong bullish sentiment in the stock, supported by moving averages and MACD analysis.
- Momentum: Momentum indicators indicate a high level of buying pressure and potential for further price appreciation.
- Volatility: High volatility as indicated by Bollinger Bands suggests potential price swings in the near term.
- Volume: Increasing volume and positive OBV and CMF indicate growing investor interest and confidence in the stock.
Conclusion:
Based on the analysis of technical indicators, the next few days for XMLV are likely to see continued upward movement in the stock price. The bullish trend, strong momentum, high volatility, and increasing volume all point towards a favorable outlook for the stock. Investors may consider buying or holding positions in XMLV for potential further gains.