Technical Analysis of XMMO 2024-05-10
Overview:
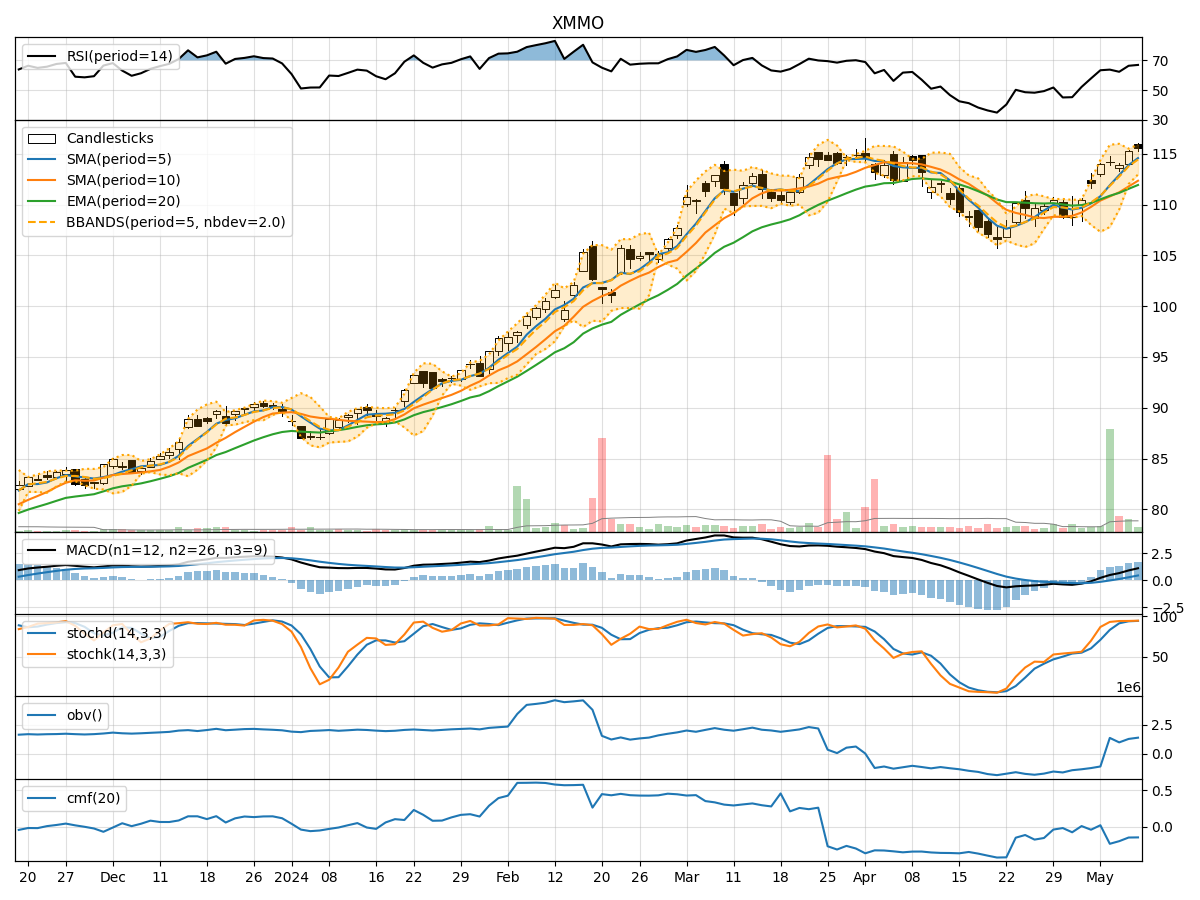
In analyzing the technical indicators for XMMO over the last 5 days, we will delve into the trend, momentum, volatility, and volume indicators to provide a comprehensive outlook on the possible stock price movement in the coming days. By examining key metrics such as moving averages, MACD, RSI, Bollinger Bands, and OBV, we aim to offer valuable insights and predictions for potential price action.
Trend Indicators:
- Moving Averages (MA): The 5-day MA has been consistently rising, indicating a bullish trend in the short term.
- MACD: The MACD line has been above the signal line, suggesting bullish momentum.
- EMA: The EMA has been trending upwards, supporting the bullish sentiment.
Momentum Indicators:
- RSI: The RSI has been in the overbought territory, signaling strong buying pressure.
- Stochastic Oscillator: Both %K and %D have been in the overbought zone, indicating a potential reversal.
- Williams %R: The indicator has been in the oversold region, suggesting a possible upward movement.
Volatility Indicators:
- Bollinger Bands: The stock price has been trading near the upper band, indicating high volatility and a potential overbought condition.
- Bollinger %B: The %B value has been above 0.8, suggesting a possible pullback in the price.
Volume Indicators:
- On-Balance Volume (OBV): The OBV has been declining, indicating distribution and potential selling pressure.
- Chaikin Money Flow (CMF): The CMF has been negative, signaling outflows and bearish sentiment.
Key Observations and Opinions:
- Trend: The trend indicators point towards a bullish sentiment in the short term.
- Momentum: While momentum indicators suggest strong buying pressure, overbought conditions may lead to a potential reversal.
- Volatility: High volatility near the upper Bollinger Band indicates a possible pullback or consolidation.
- Volume: Declining OBV and negative CMF signal potential selling pressure and bearish sentiment.
Conclusion:
Based on the analysis of technical indicators, the next few days for XMMO stock price may see a potential pullback or consolidation after the recent bullish run. Traders should be cautious of overbought conditions and high volatility levels, which could lead to a short-term correction. It is advisable to closely monitor key support and resistance levels for better entry and exit points in alignment with the market dynamics.