Technical Analysis of XMPT 2024-05-10
Overview:
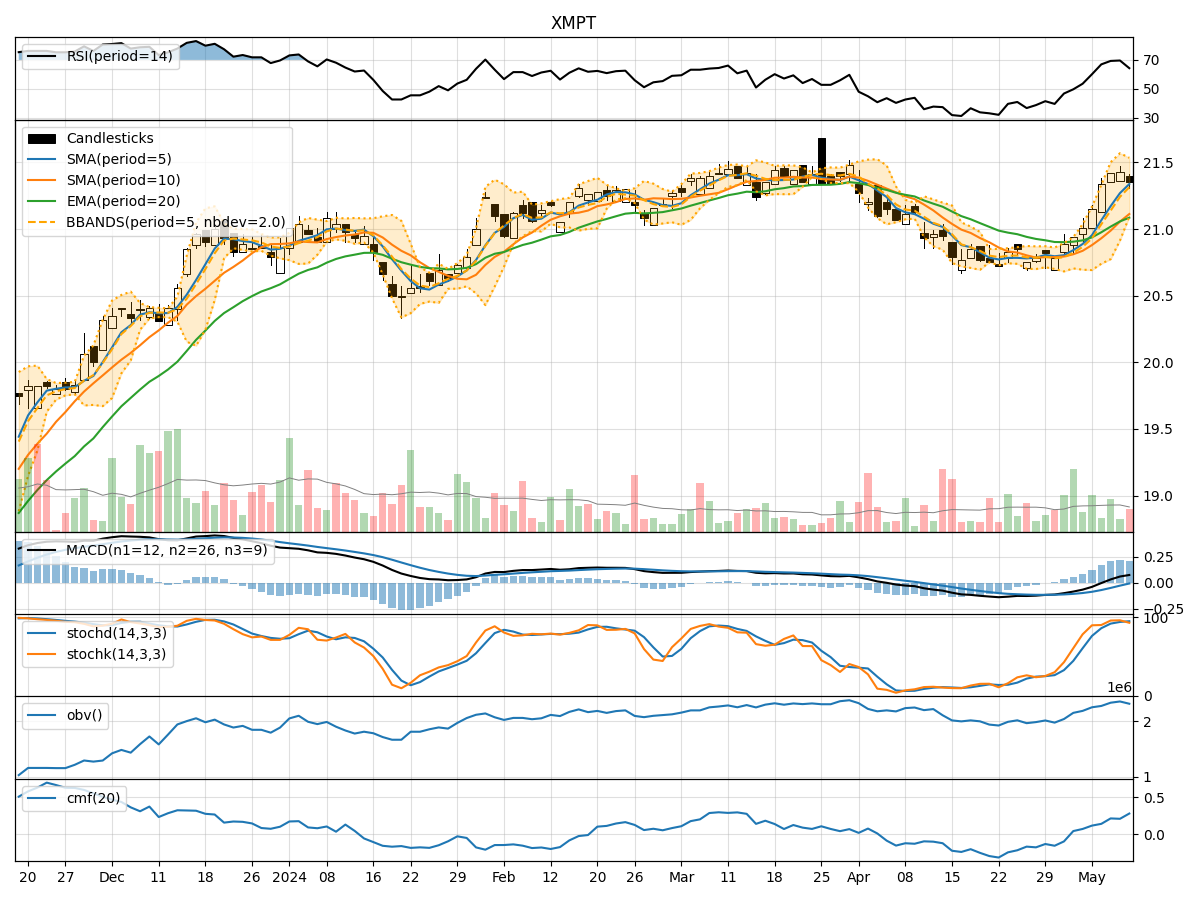
In the last 5 trading days, XMPT stock has shown a consistent uptrend in its price, supported by positive momentum and volatility indicators. The moving averages have been trending upwards, and the MACD has been indicating bullish momentum. Additionally, the RSI and Stochastic indicators have been in overbought territory, suggesting strong buying pressure. The Bollinger Bands have been expanding, indicating increased volatility. Overall, the technical indicators point towards a bullish sentiment in the short term.
Trend Indicators Analysis:
- Moving Averages (MA): The 5-day MA has been consistently above the 10-day SMA, indicating a short-term bullish trend.
- MACD: The MACD line has been above the signal line, with both lines trending upwards, indicating increasing bullish momentum.
Momentum Indicators Analysis:
- RSI: The RSI has been in the overbought zone, suggesting that the stock may be overvalued in the short term.
- Stochastic Oscillator: Both %K and %D have been in the overbought region, indicating a strong bullish momentum.
Volatility Indicators Analysis:
- Bollinger Bands: The Bollinger Bands have been widening, indicating increased volatility in the stock price.
Volume Indicators Analysis:
- On-Balance Volume (OBV): The OBV has been trending upwards, indicating that volume has been higher on up days compared to down days.
- Chaikin Money Flow (CMF): The CMF has been positive, suggesting that money is flowing into the stock.
Key Observations:
- The stock is currently in a strong uptrend, supported by bullish trend and momentum indicators.
- The overbought conditions in RSI and Stochastic suggest a potential pullback or consolidation in the short term.
- The expanding Bollinger Bands indicate increased volatility, which could lead to larger price swings.
- The positive OBV and CMF indicate strong buying interest in the stock.
Conclusion:
Based on the analysis of the technical indicators, the next few days' possible stock price movement for XMPT is likely to experience a short-term pullback or consolidation due to the overbought conditions in RSI and Stochastic indicators. However, the overall trend remains bullish, supported by the positive momentum and volume indicators. Traders may consider taking profits or waiting for a better entry point during the anticipated pullback. Long-term investors can continue to hold their positions, considering the overall positive trend in the stock.