Technical Analysis of XNAV 2024-05-10
Overview:
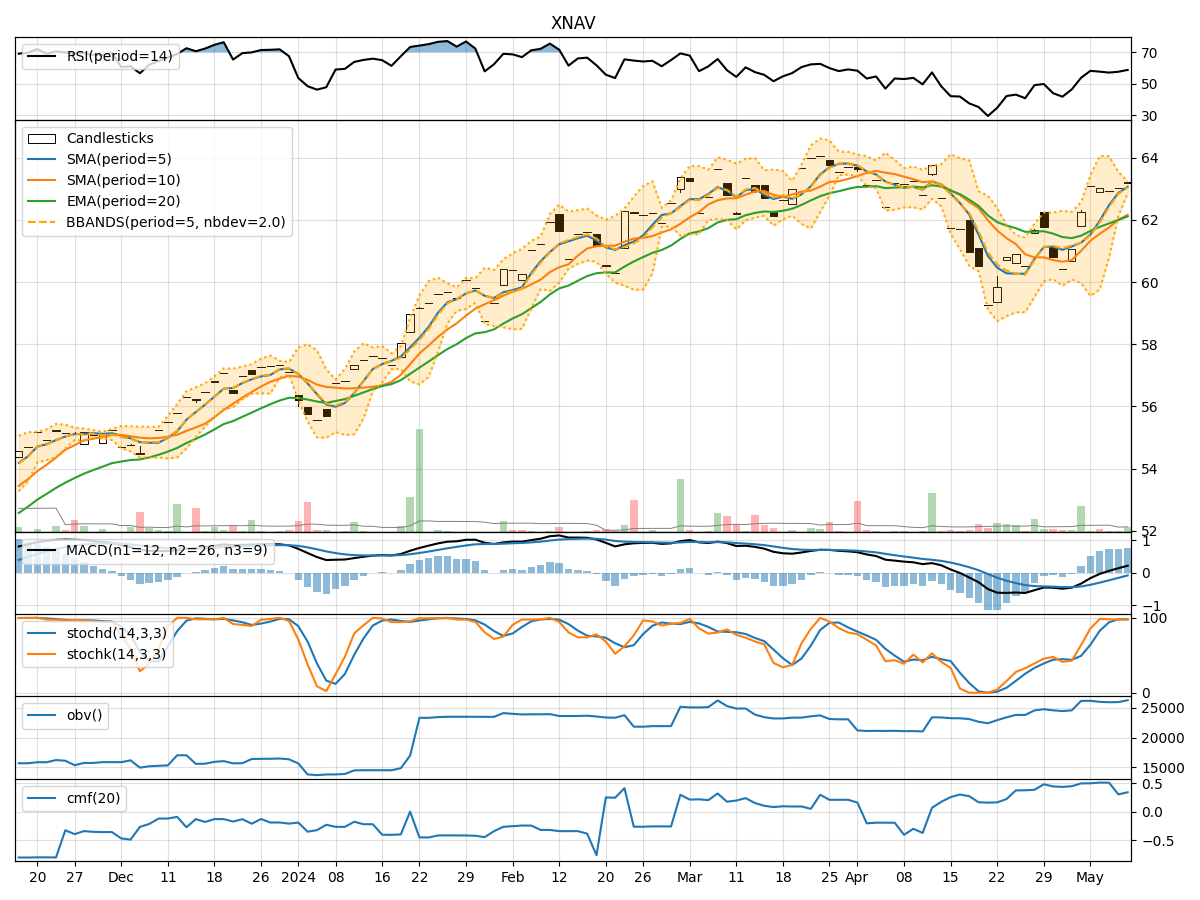
In the last 5 trading days, XNAV stock has shown a consistent uptrend in its price, supported by increasing volumes. The moving averages have been trending upwards, indicating a positive momentum. The MACD and RSI are also showing bullish signals. However, the Bollinger Bands are narrowing, suggesting a potential decrease in volatility.
Trend Indicators Analysis:
- Moving Averages (MA): The 5-day MA has been consistently above the 10-day SMA, indicating a short-term bullish trend.
- MACD: The MACD line has been above the signal line for the past 5 days, indicating a bullish momentum.
- MACD Histogram: The MACD histogram has been increasing, showing strengthening bullish momentum.
Momentum Indicators Analysis:
- RSI: The RSI has been in the overbought territory but has not shown any signs of divergence, indicating strong buying pressure.
- Stochastic Oscillator: Both %K and %D lines of the Stochastic Oscillator are in the overbought zone, suggesting a strong upward momentum.
- Williams %R: The Williams %R is also in the overbought region, indicating a potential reversal.
Volatility Indicators Analysis:
- Bollinger Bands: The Bollinger Bands are narrowing, suggesting a decrease in volatility and a potential period of consolidation.
- Bollinger %B: The %B indicator is above 0.8, indicating that the stock is trading near the upper band, potentially signaling an overbought condition.
Volume Indicators Analysis:
- On-Balance Volume (OBV): The OBV has been increasing, indicating that volume has been higher on up days compared to down days.
- Chaikin Money Flow (CMF): The CMF is positive, suggesting that money is flowing into the stock.
Key Observations:
- The stock is currently in a strong uptrend, supported by positive momentum and volume indicators.
- The narrowing Bollinger Bands suggest a potential period of consolidation or a minor pullback in the stock price.
- The overbought conditions in RSI, Stochastic, and Williams %R indicate a possibility of a short-term correction.
Conclusion:
Based on the technical indicators and analysis: - Short-Term: The stock is likely to experience a period of consolidation or a minor pullback in the next few days due to overbought conditions and narrowing Bollinger Bands. - Medium- to Long-Term: The overall trend remains bullish, and any pullback could present a buying opportunity for investors looking to enter or add to their positions in the stock.
Recommendation:
- Short-Term Traders: Consider taking profits or tightening stop-loss levels to protect gains during the potential consolidation phase.
- Long-Term Investors: Use any pullback as an opportunity to accumulate more shares in line with the overall bullish trend.
Disclaimer:
This analysis is based solely on technical indicators and does not take into account fundamental factors or external market influences. It is essential to conduct thorough research and consider all aspects before making any investment decisions.