Technical Analysis of XNOV 2024-05-10
Overview:
In analyzing the technical indicators for XNOV stock over the last 5 days, we will delve into the trend, momentum, volatility, and volume indicators to provide a comprehensive outlook on the possible stock price movement in the coming days. By examining these key indicators, we aim to offer valuable insights and predictions to guide investment decisions.
Trend Indicators:
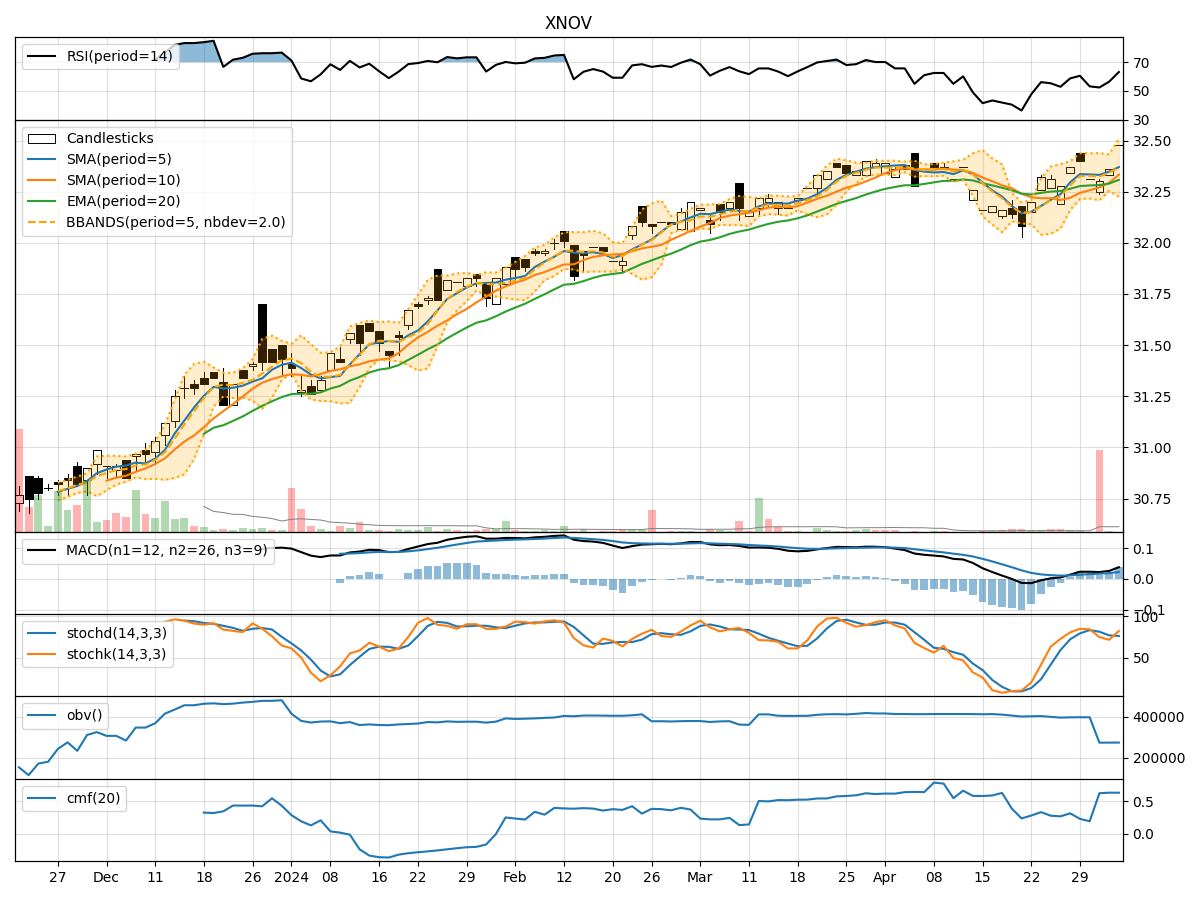
- Moving Averages (MA): The 5-day MA has been consistently above the 10-day SMA, indicating a short-term bullish trend. The EMA(20) has been steadily increasing, reflecting positive momentum.
- MACD: The MACD line has been above the signal line, with both lines showing an upward trend. The MACD histogram has been increasing, suggesting strengthening bullish momentum.
Momentum Indicators:
- RSI: The RSI has been trending upwards, indicating increasing buying pressure and potential overbought conditions.
- Stochastic Oscillator: Both %K and %D have been at 100%, signaling strong bullish momentum and potential overbought conditions.
- Williams %R: The indicator has consistently been at 0, suggesting the stock is in overbought territory.
Volatility Indicators:
- Bollinger Bands (BB): The stock price has been trading within the upper Bollinger Band, indicating an overbought condition. The bands are relatively narrow, suggesting low volatility.
- Bollinger %B: The %B has been above 0.8, indicating the stock is trading near the upper band and potentially overbought.
Volume Indicators:
- On-Balance Volume (OBV): The OBV has been slightly decreasing, indicating some distribution happening in the stock.
- Chaikin Money Flow (CMF): The CMF has been positive, suggesting buying pressure in the stock over the past 20 days.
Key Observations and Opinions:
- Trend: The stock is in a strong short-term bullish trend based on moving averages and MACD.
- Momentum: Momentum indicators suggest the stock is in overbought territory, which could lead to a potential pullback.
- Volatility: Low volatility and overbought conditions based on Bollinger Bands indicate a possible consolidation phase.
- Volume: The slight decrease in OBV signals some distribution, which could impact the stock price.
Conclusion:
Based on the technical indicators and analysis: - Short-term View: The stock is currently in an overbought condition with strong bullish momentum. - Next Few Days Prediction: Considering the overbought signals and potential for a pullback, the stock price may experience a short-term correction or consolidation before potentially resuming its uptrend. - Recommendation: Investors should exercise caution and consider waiting for a better entry point during a potential pullback before considering long positions. Short-term traders may look for opportunities to capitalize on the expected price consolidation.
Disclaimer:
Remember that technical analysis is not a guaranteed predictor of future price movements, and other fundamental factors can influence stock prices. It is essential to conduct thorough research and consider multiple indicators before making investment decisions. Consulting with a financial advisor is recommended for personalized investment advice.