Technical Analysis of XNTK 2024-05-10
Overview:
In analyzing the technical indicators for XNTK over the last 5 days, we will delve into the trend, momentum, volatility, and volume indicators to provide a comprehensive outlook on the possible stock price movement. By examining these key aspects, we aim to offer valuable insights and predictions for the upcoming days.
Trend Analysis:
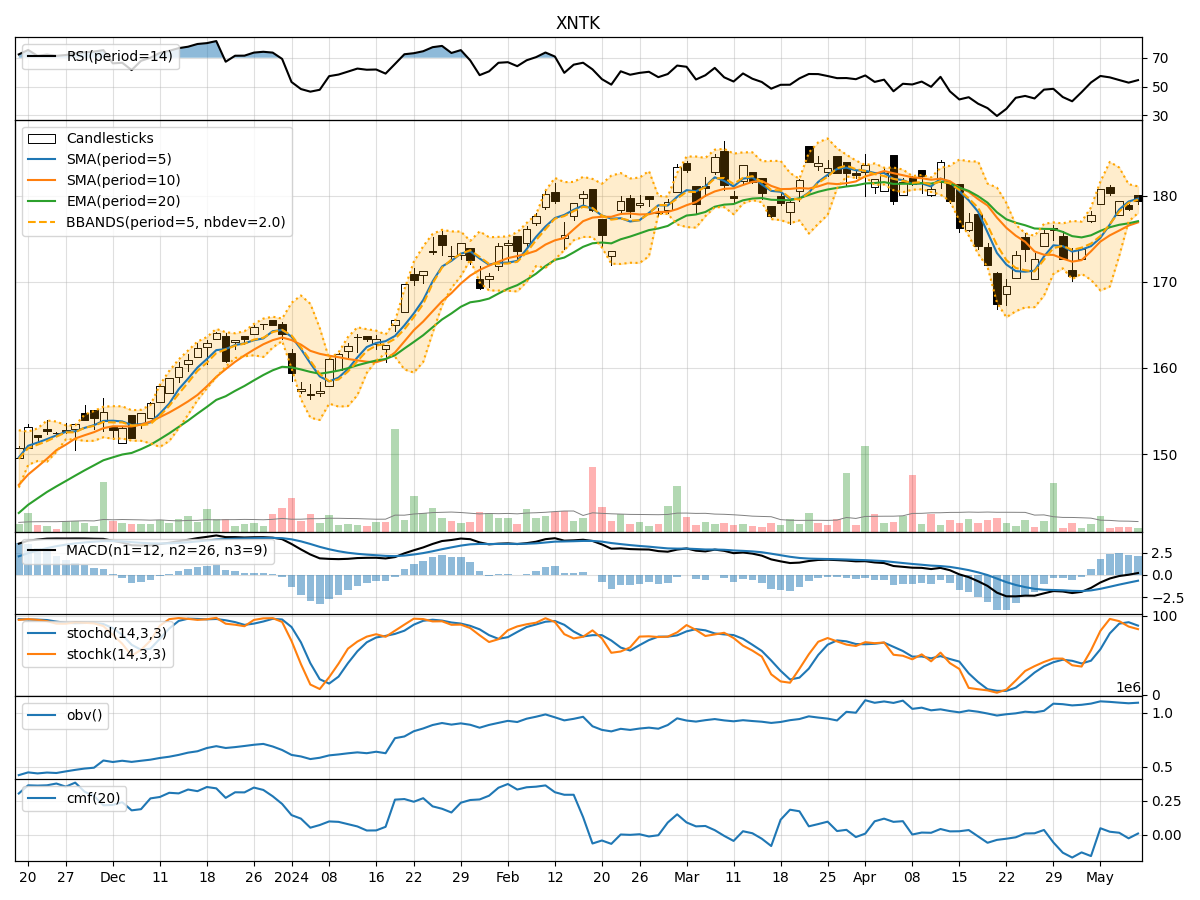
- Moving Averages (MA): The 5-day Moving Average (MA) has been consistently above the Simple Moving Average (SMA) and Exponential Moving Average (EMA), indicating a bullish trend.
- MACD: The MACD line has been above the signal line for the past few days, suggesting a positive momentum in the stock price.
- MACD Histogram: The MACD Histogram has been increasing, indicating strengthening bullish momentum.
Momentum Analysis:
- RSI: The Relative Strength Index (RSI) has been fluctuating around the mid-level, indicating a neutral momentum.
- Stochastic Oscillator: Both %K and %D have been declining, suggesting a potential bearish momentum.
- Williams %R: The Williams %R is in the oversold territory, indicating a possible reversal in momentum.
Volatility Analysis:
- Bollinger Bands (BB): The stock price has been trading within the Bollinger Bands, with the bands narrowing, indicating decreasing volatility.
- Bollinger %B: The %B indicator is hovering around the middle, suggesting a neutral volatility outlook.
Volume Analysis:
- On-Balance Volume (OBV): The OBV has been fluctuating, indicating mixed buying and selling pressure.
- Chaikin Money Flow (CMF): The CMF has been positive but decreasing, signaling a potential decrease in buying pressure.
Conclusion:
Based on the analysis of the technical indicators: - Trend: The stock is in an upward trend supported by moving averages and MACD. - Momentum: The momentum is neutral to bearish based on RSI and Stochastic Oscillator. - Volatility: Volatility is decreasing, suggesting a possible period of consolidation. - Volume: The volume indicators show mixed signals with fluctuating OBV and decreasing CMF.
Forecast:
Considering the overall analysis, the next few days may see the stock price experiencing consolidation or a slight pullback due to the neutral to bearish momentum and decreasing volatility. Traders should monitor key support and resistance levels for potential entry or exit points. It is advisable to wait for clearer signals before making significant trading decisions.