Technical Analysis of XOCT 2024-05-10
Overview:
In analyzing the technical indicators for XOCT over the last 5 days, we will delve into the trend, momentum, volatility, and volume indicators to provide a comprehensive outlook on the possible stock price movement in the coming days. By examining these key aspects, we aim to offer valuable insights and predictions to guide your investment decisions.
Trend Analysis:
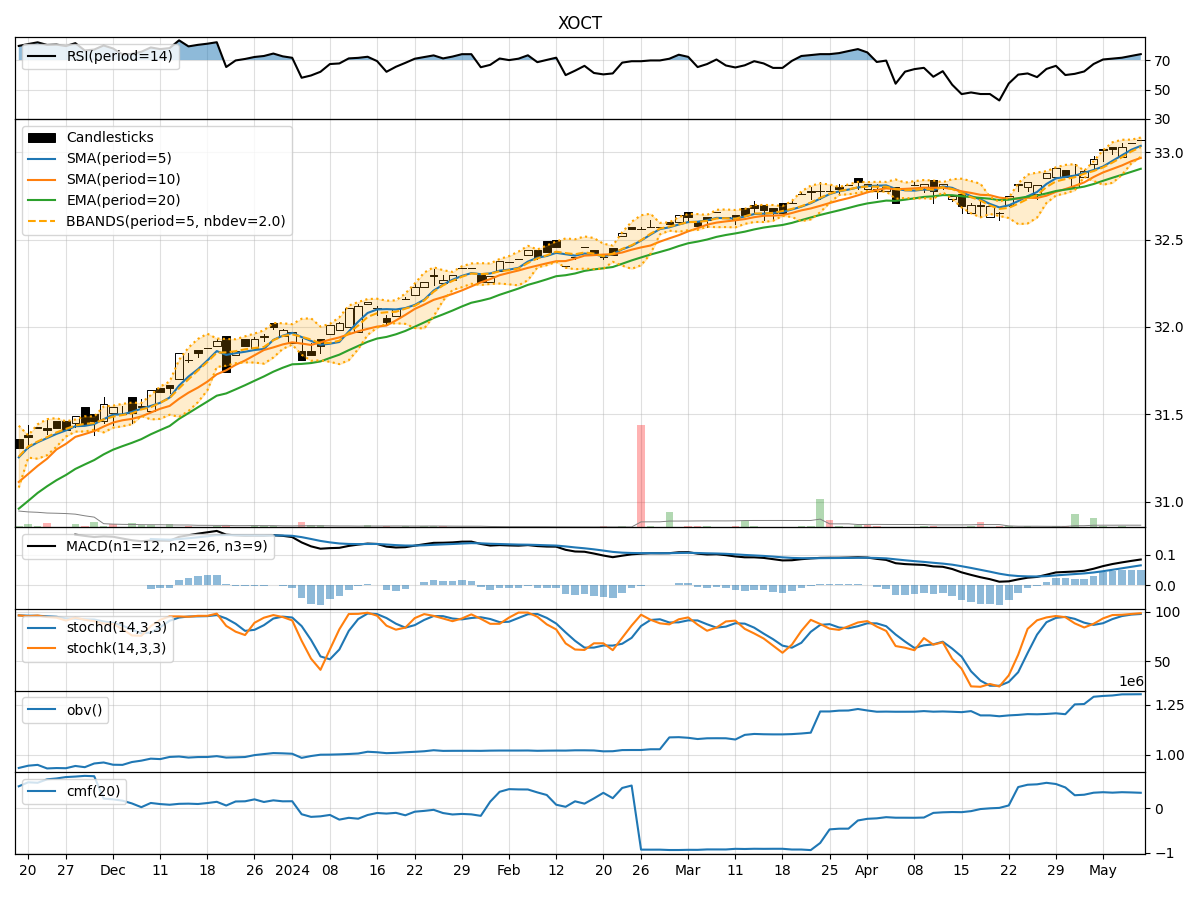
- Moving Averages (MA): The 5-day MA has been consistently rising, indicating a bullish trend in the short term.
- MACD: The MACD line has been increasing, suggesting upward momentum in price.
- RSI: The RSI values have been steadily climbing, reflecting increasing buying pressure.
Key Observation: The trend indicators point towards a bullish sentiment in the stock price movement.
Momentum Analysis:
- Stochastic Oscillator: Both %K and %D values are in the overbought zone, signaling a strong bullish momentum.
- Williams %R: The indicator is in the oversold region, indicating a potential reversal in price direction.
Key Observation: Momentum indicators suggest a strong bullish momentum in the stock.
Volatility Analysis:
- Bollinger Bands (BB): The bands have been narrowing, indicating decreasing volatility.
- BB %B: The %B value is increasing, suggesting a potential breakout in price.
Key Observation: Volatility indicators imply a potential breakout in the stock price.
Volume Analysis:
- On-Balance Volume (OBV): The OBV has been steadily increasing, indicating accumulation by investors.
- Chaikin Money Flow (CMF): The CMF value is positive, reflecting buying pressure.
Key Observation: Volume indicators signal positive accumulation and buying interest in the stock.
Conclusion:
Based on the analysis of trend, momentum, volatility, and volume indicators, the overall outlook for XOCT stock is bullish. The trend is positive, momentum is strong, volatility is decreasing with a potential breakout, and volume indicators show accumulation. Therefore, the next few days are likely to see an upward movement in the stock price.
Recommendation:
Considering the bullish signals across various technical indicators, it is advisable to consider buying XOCT stock for potential short to medium-term gains. However, it is essential to monitor the price action closely for any signs of reversal or consolidation.
Remember, while technical analysis provides valuable insights, it is crucial to combine it with fundamental analysis and risk management strategies for a well-rounded investment approach.