Technical Analysis of XPH 2024-05-10
Overview:
In analyzing the technical indicators for XPH over the last 5 days, we will delve into the trend, momentum, volatility, and volume indicators to provide a comprehensive outlook on the possible stock price movement in the coming days. By examining these key aspects, we aim to offer valuable insights and predictions to guide your investment decisions.
Trend Analysis:
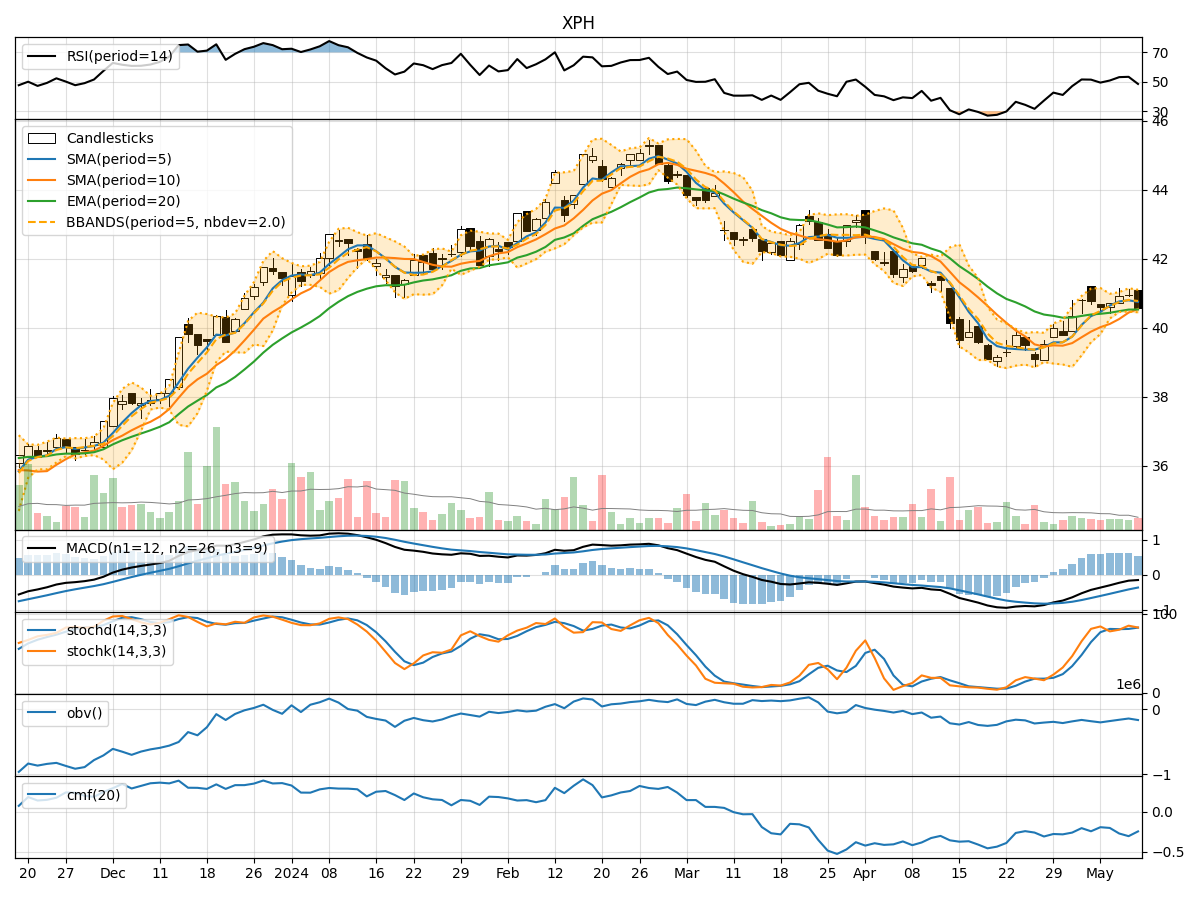
- Moving Averages (MA): The 5-day Moving Average (MA) has been fluctuating around the closing prices, indicating short-term price trends. The Simple Moving Average (SMA) and Exponential Moving Average (EMA) have shown a slight upward trend, suggesting potential bullish momentum.
- MACD: The Moving Average Convergence Divergence (MACD) has been negative but showing signs of convergence towards the signal line, indicating a possible reversal in the bearish trend.
- Conclusion: The trend indicators suggest a potential bullish reversal in the stock price movement.
Momentum Analysis:
- RSI: The Relative Strength Index (RSI) has been hovering around the neutral zone, indicating a balanced momentum between buying and selling pressure.
- Stochastic Oscillator: Both %K and %D have been fluctuating within the overbought and oversold levels, suggesting a mixed sentiment among traders.
- Conclusion: The momentum indicators reflect a neutral stance with no clear direction in the short term.
Volatility Analysis:
- Bollinger Bands: The Bollinger Bands have shown narrowing volatility, with the stock price approaching the lower band, indicating a potential consolidation phase.
- Conclusion: The volatility indicators point towards a sideways movement or consolidation in the stock price.
Volume Analysis:
- On-Balance Volume (OBV): The OBV has been declining, indicating a decrease in buying pressure and potential distribution of shares.
- Chaikin Money Flow (CMF): The CMF has also been negative, suggesting a lack of buying interest in the stock.
- Conclusion: The volume indicators signal a bearish sentiment with decreasing buying pressure.
Overall Conclusion:
Based on the analysis of trend, momentum, volatility, and volume indicators, the stock price of XPH is likely to experience a bullish reversal in the short term, supported by the positive trend indicators. However, the momentum remains neutral, indicating a lack of strong buying or selling pressure. The volatility suggests a potential consolidation phase, while the volume indicators point towards a bearish sentiment.
In conclusion, while there are indications of a bullish reversal, investors should exercise caution due to the mixed signals in momentum and the bearish volume sentiment. It is advisable to closely monitor the price action and wait for confirmation of a sustained uptrend before making any significant investment decisions.