Technical Analysis of XPND 2024-05-10
Overview:
In analyzing the technical indicators for XPND over the last 5 days, we will delve into the trend, momentum, volatility, and volume indicators to provide a comprehensive outlook on the possible stock price movement in the coming days. By examining these key indicators, we aim to offer valuable insights and predictions to guide investment decisions.
Trend Analysis:
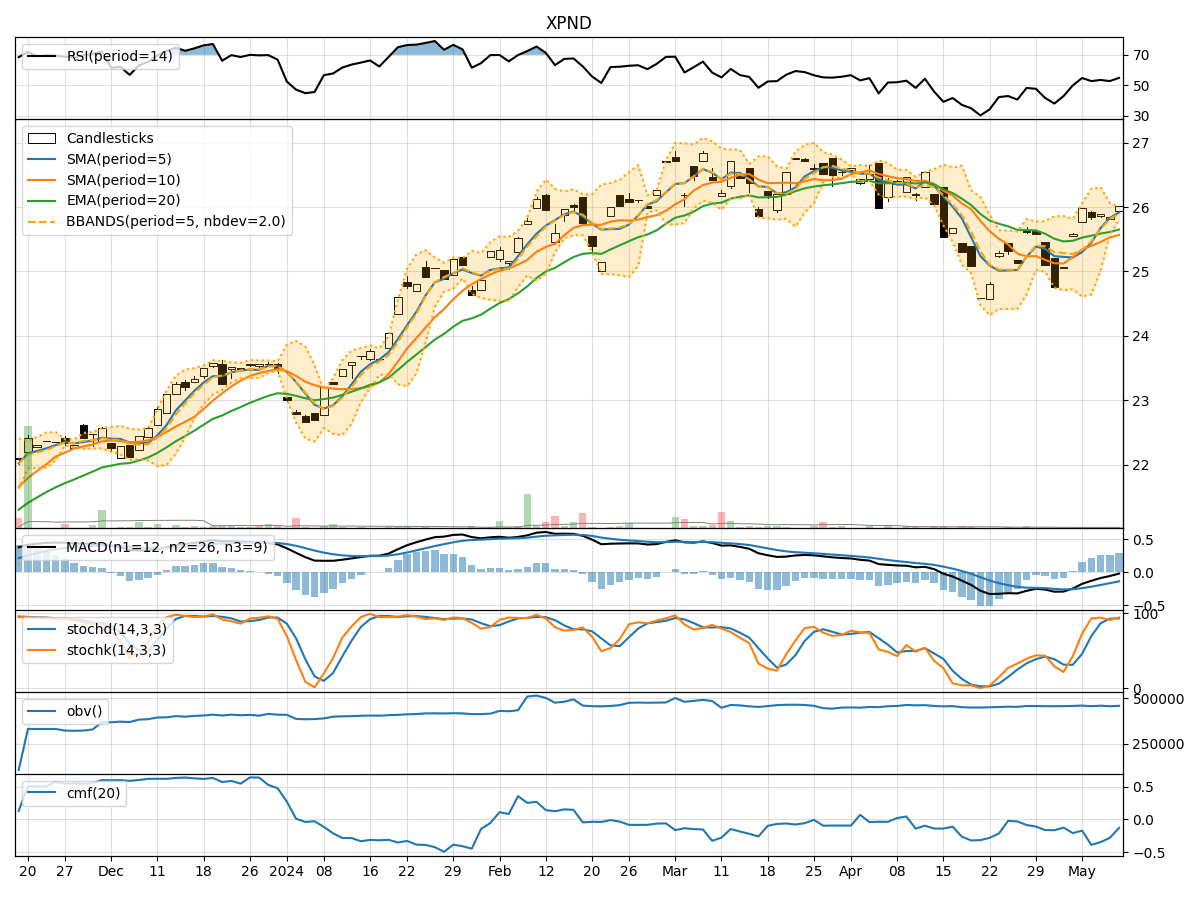
- Moving Averages (MA): The 5-day MA has been consistently above the closing prices, indicating a bullish trend.
- MACD: The MACD line has been below the signal line but trending upwards, suggesting a potential bullish crossover.
- RSI: The RSI has been fluctuating around the 50 level, indicating a neutral stance in terms of momentum.
Momentum Analysis:
- Stochastic Oscillator: The Stochastic Oscillator has been in the overbought zone, signaling a potential reversal or consolidation.
- Williams %R: The Williams %R has shown mixed signals, hovering around the oversold territory.
Volatility Analysis:
- Bollinger Bands (BB): The narrowing of the Bollinger Bands suggests decreasing volatility and a possible period of consolidation.
- BB% (BB Percentage): The BB% has been fluctuating, indicating potential price reversals or breakouts.
Volume Analysis:
- On-Balance Volume (OBV): The OBV has shown mixed movements, reflecting uncertainty in the buying and selling pressure.
- Chaikin Money Flow (CMF): The CMF has been negative, indicating a lack of strong buying pressure.
Key Observations:
- The trend indicators suggest a bullish bias, supported by the moving averages and potential MACD crossover.
- Momentum indicators show conflicting signals, with the Stochastic Oscillator in the overbought zone and the Williams %R near oversold levels.
- Volatility indicators point towards a period of consolidation, as seen in the narrowing Bollinger Bands.
- Volume indicators reflect mixed sentiments, with the OBV and CMF indicating a lack of strong buying pressure.
Conclusion:
Based on the analysis of the technical indicators, the stock price of XPND is likely to experience sideways movement or consolidation in the coming days. The bullish trend indicated by the moving averages and potential MACD crossover may be hindered by conflicting momentum signals and lackluster volume support. Traders should exercise caution and wait for clearer signals before making significant trading decisions.