Technical Analysis of XRLV 2024-05-10
Overview:
In analyzing the technical indicators for XRLV over the last 5 days, we will delve into the trend, momentum, volatility, and volume indicators to provide a comprehensive outlook on the possible stock price movement in the coming days. By examining these key aspects, we aim to offer valuable insights and predictions for potential investors.
Trend Indicators:
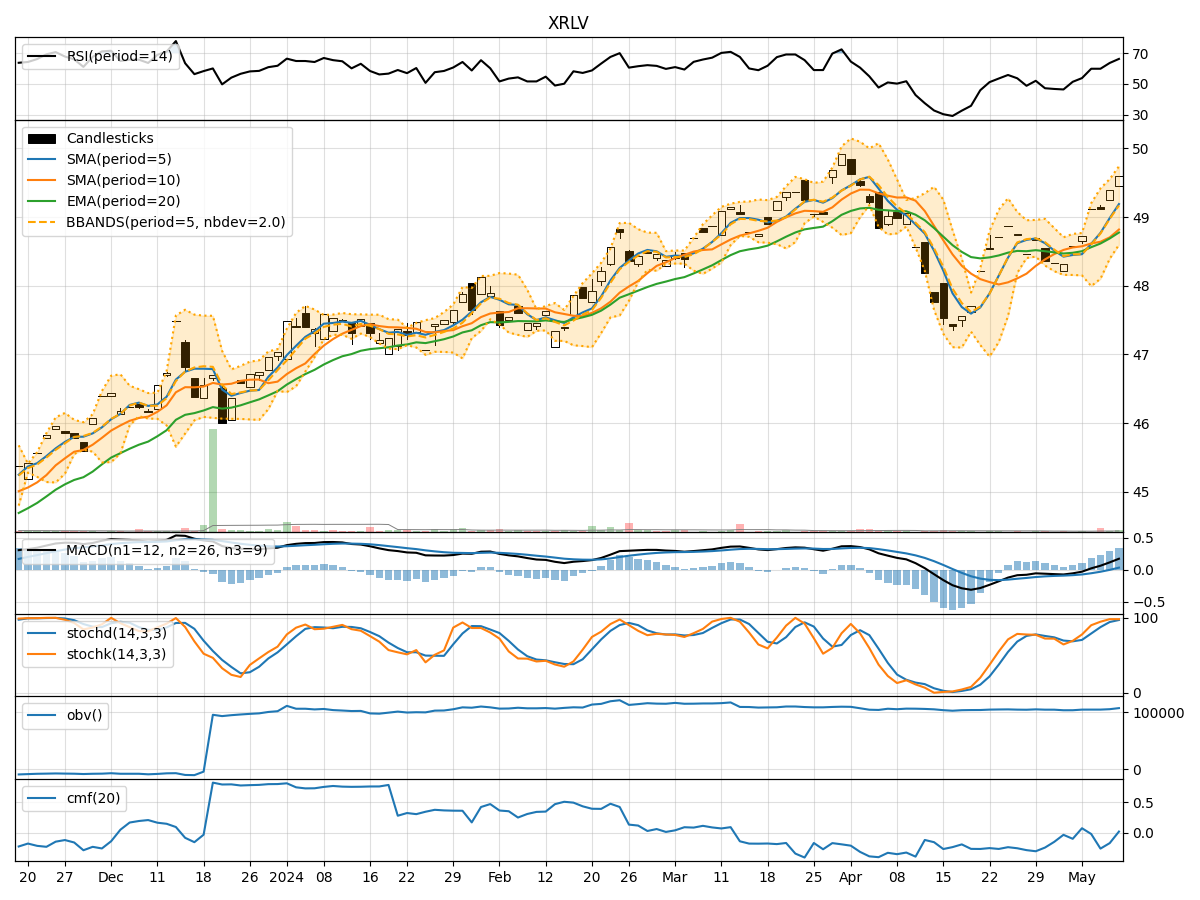
- Moving Averages (MA): The 5-day moving average has been consistently above the simple moving average (SMA) of 10 days, indicating a short-term bullish trend.
- Exponential Moving Average (EMA): The EMA has been trending upwards, suggesting a positive momentum in the stock price.
- Moving Average Convergence Divergence (MACD): The MACD and signal line have been in positive territory, indicating a bullish trend.
- Conclusion: The trend indicators suggest an upward momentum in the stock price.
Momentum Indicators:
- Relative Strength Index (RSI): The RSI has been increasing and is in the overbought territory, indicating a strong bullish momentum.
- Stochastic Oscillator: Both %K and %D have been consistently high, signaling a strong buying pressure.
- Williams %R (Willams %R): The indicator is in the oversold region, suggesting a potential reversal.
- Conclusion: Momentum indicators point towards a bullish sentiment in the stock.
Volatility Indicators:
- Bollinger Bands (BB): The stock price has been trading within the upper Bollinger Band, indicating high volatility.
- Conclusion: Volatility indicators suggest that the stock is experiencing high volatility.
Volume Indicators:
- On-Balance Volume (OBV): The OBV has been fluctuating, indicating mixed buying and selling pressure.
- Chaikin Money Flow (CMF): The CMF has been negative, suggesting a bearish sentiment.
- Conclusion: Volume indicators show a mixed sentiment in terms of buying and selling pressure.
Overall Conclusion:
Based on the analysis of trend, momentum, volatility, and volume indicators, the overall outlook for XRLV in the next few days is bullish. The trend indicators point towards an upward momentum, supported by strong bullish signals from momentum indicators like RSI and Stochastic Oscillator. However, the high volatility and mixed volume indicators suggest that there might be some fluctuations in the stock price.
Recommendation:
Considering the bullish trend and momentum, investors could consider buying XRLV in the short term. It is essential to monitor the stock closely for any signs of reversal or increased volatility. Additionally, setting stop-loss orders to manage risk would be prudent in this scenario.
Disclaimer:
Please note that while technical analysis provides valuable insights, it is essential to consider other fundamental factors and market dynamics before making investment decisions. It is advisable to consult with a financial advisor to align your investment strategy with your financial goals and risk tolerance level.