Technical Analysis of XRT 2024-05-10
Overview:
In analyzing the technical indicators for XRT over the last 5 days, we will delve into the trend, momentum, volatility, and volume indicators to provide a comprehensive outlook on the possible stock price movement in the coming days. By examining these key aspects, we aim to offer valuable insights and predictions for potential investors.
Trend Analysis:
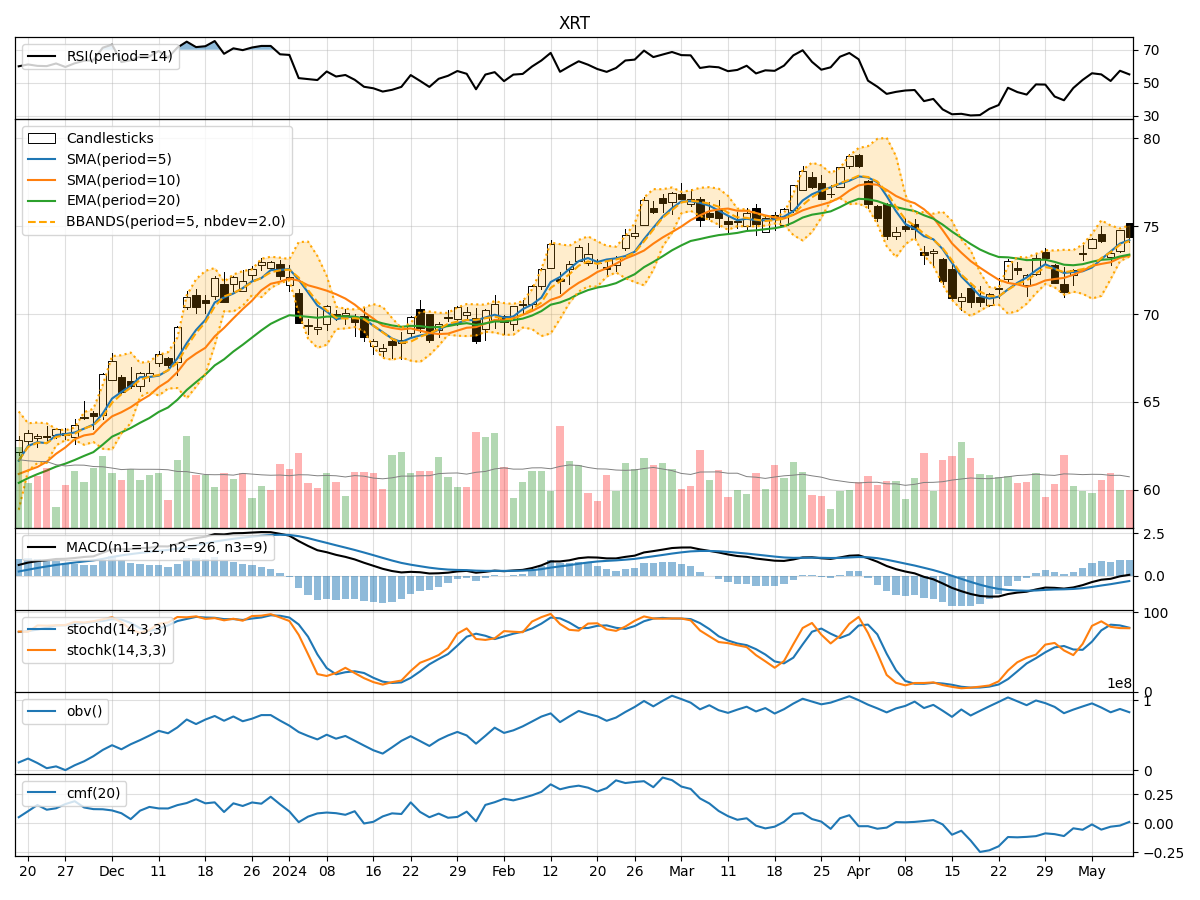
- Moving Averages (MA): The 5-day MA has been consistently above the closing prices, indicating a short-term uptrend.
- MACD: The MACD line has been positive, suggesting bullish momentum.
- EMA: The EMA has been trending upwards, supporting the bullish sentiment.
Key Observation: The trend indicators point towards an upward movement in the stock price.
Momentum Analysis:
- RSI: The RSI has been fluctuating around the neutral zone, indicating indecision in the market.
- Stochastic Oscillator: Both %K and %D have been in the overbought region, signaling a potential reversal.
- Williams %R: The indicator has been in the oversold territory, suggesting a possible buying opportunity.
Key Observation: The momentum indicators suggest a mixed sentiment with a slight bearish bias.
Volatility Analysis:
- Bollinger Bands: The stock price has been trading within the bands, indicating normal volatility.
- Bollinger %B: The %B indicator has been fluctuating around the midline, reflecting equilibrium in price movement.
Key Observation: Volatility indicators suggest a sideways movement in the stock price.
Volume Analysis:
- On-Balance Volume (OBV): The OBV has been fluctuating, indicating mixed buying and selling pressure.
- Chaikin Money Flow (CMF): The CMF has been negative, suggesting outflow of money from the stock.
Key Observation: Volume indicators reflect mixed sentiment with a slight bearish bias.
Conclusion:
Based on the analysis of trend, momentum, volatility, and volume indicators, the overall outlook for XRT in the next few days is as follows: - Trend: Upward - Momentum: Mixed with a Bearish Bias - Volatility: Sideways - Volume: Mixed with a Bearish Bias
Final Verdict:
Considering the comprehensive analysis of technical indicators, the next few days for XRT are likely to see upward price movement, albeit with mixed momentum and sideways volatility. Investors should exercise caution and consider the potential for a short-term reversal based on the momentum indicators.