Technical Analysis of XSD 2024-05-10
Overview:
In analyzing the technical indicators for XSD over the last 5 days, we will delve into the trend, momentum, volatility, and volume indicators to provide a comprehensive outlook on the possible stock price movement in the coming days.
Trend Analysis:
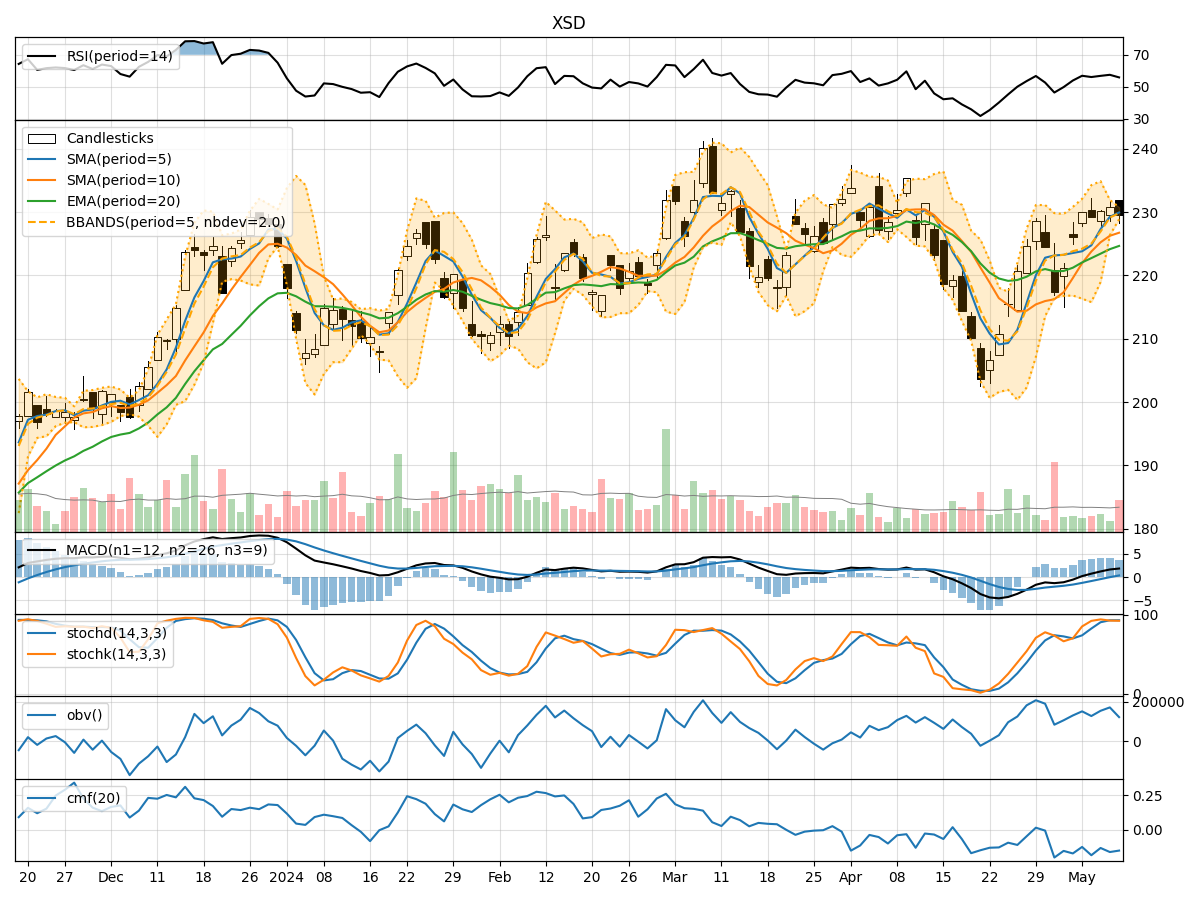
- Moving Averages (MA): The 5-day Moving Average (MA) has been consistently above the Simple Moving Average (SMA) and Exponential Moving Average (EMA), indicating a bullish trend.
- MACD: The MACD line has been above the signal line, with the MACD Histogram showing positive values, suggesting bullish momentum.
Momentum Analysis:
- RSI: The Relative Strength Index (RSI) has been hovering around the mid-level, indicating neutral momentum.
- Stochastic Oscillator: Both %K and %D have been in the overbought zone, suggesting a potential reversal or consolidation.
- Williams %R: The Williams %R is in the oversold territory, indicating a possible buying opportunity.
Volatility Analysis:
- Bollinger Bands (BB): The stock price has been trading within the Bollinger Bands, with the %B indicating a neutral position.
- Volatility: The volatility has been relatively stable over the past few days, with no significant spikes or drops.
Volume Analysis:
- On-Balance Volume (OBV): The OBV has shown mixed signals, with no clear trend in volume accumulation or distribution.
- Chaikin Money Flow (CMF): The CMF has been negative, indicating selling pressure in the market.
Key Observations:
- The trend indicators suggest a bullish sentiment in the short term.
- Momentum indicators show a mixed picture, with potential signs of a reversal or consolidation.
- Volatility remains stable, indicating a lack of significant market fluctuations.
- Volume indicators reflect uncertainty in market participation and investor sentiment.
Conclusion:
Based on the analysis of the technical indicators, the next few days' possible stock price movement for XSD is likely to be bullish in the short term. However, caution is advised as momentum indicators show signs of a potential reversal or consolidation. Traders should closely monitor key support and resistance levels to assess the sustainability of the bullish trend. Overall, a cautious bullish outlook is recommended with a keen eye on momentum indicators for any shifts in market sentiment.