Technical Analysis of XSHD 2024-05-10
Overview:
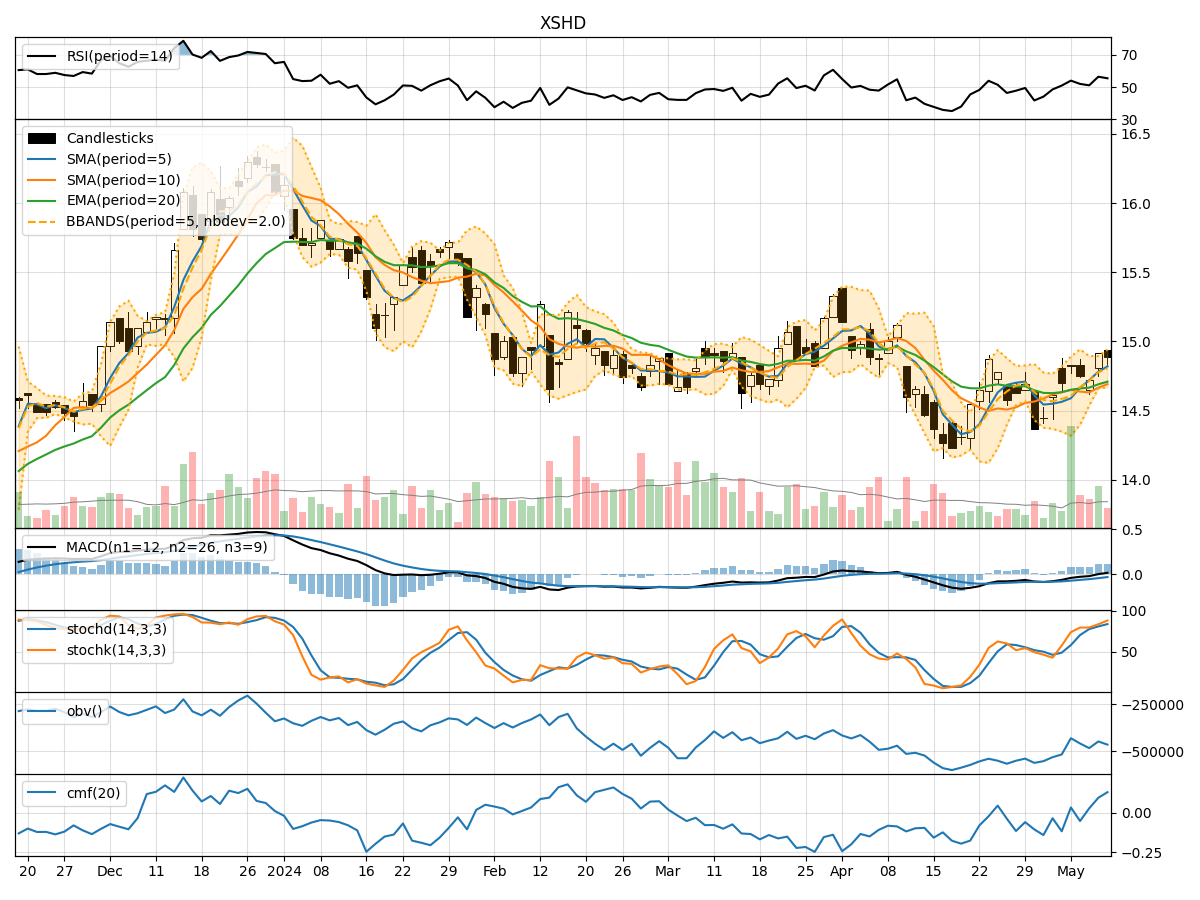
In analyzing the technical indicators for XSHD over the last 5 days, we will delve into the trend, momentum, volatility, and volume indicators to provide a comprehensive outlook on the possible stock price movement in the coming days. By examining these key aspects, we aim to offer valuable insights and predictions to guide your investment decisions.
Trend Analysis:
- Moving Averages (MA): The 5-day MA has been trending slightly above the closing prices, indicating a short-term uptrend.
- MACD: The MACD line has been consistently positive, suggesting bullish momentum.
- RSI: The RSI values have been fluctuating around the mid-level, indicating a balanced market sentiment.
Key Observation: The trend indicators suggest a mildly bullish sentiment in the short term.
Momentum Analysis:
- Stochastic Oscillator: Both %K and %D values have been in the overbought territory, signaling potential for a reversal.
- Williams %R: The indicator has shown oversold conditions on some days, hinting at possible buying opportunities.
Key Observation: Momentum indicators point towards a potential reversal or consolidation phase.
Volatility Analysis:
- Bollinger Bands (BB): The bands have been relatively narrow, indicating low volatility in the stock price.
- BB %B: The %B values have been hovering around the midline, suggesting a lack of strong trend.
Key Observation: Volatility indicators reflect a period of consolidation or sideways movement.
Volume Analysis:
- On-Balance Volume (OBV): The OBV values have been negative, indicating distribution by investors.
- Chaikin Money Flow (CMF): The CMF has shown some positive values, suggesting potential buying pressure.
Key Observation: Volume indicators signal a divergence in investor sentiment, with some accumulation alongside distribution.
Conclusion:
Based on the analysis of the technical indicators, the next few days for XSHD could see sideways movement or consolidation in the stock price. The trend indicators point towards a mild bullish sentiment, while momentum indicators suggest a potential reversal or consolidation phase. Volatility indicators indicate a lack of strong trend, and volume indicators show mixed investor sentiment.
Overall, the stock is likely to trade within a range with no clear directional bias in the near term. It is advisable to closely monitor key support and resistance levels for potential breakout opportunities.
Remember, market conditions can change rapidly, so it's essential to stay updated with real-time data and adjust your strategy accordingly.