Technical Analysis of XSHQ 2024-05-10
Overview:
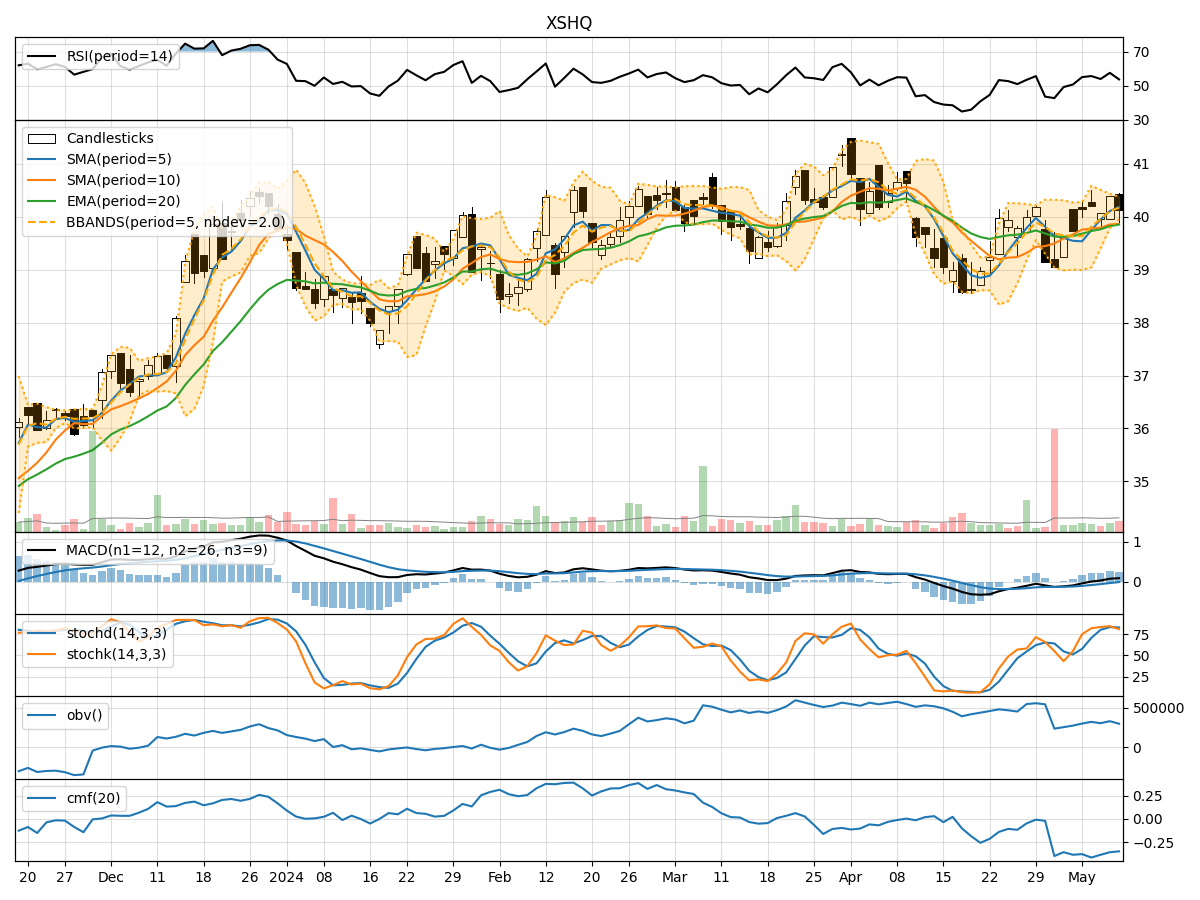
In analyzing the technical indicators for XSHQ over the last 5 days, we will delve into the trend, momentum, volatility, and volume indicators to provide a comprehensive outlook on the possible stock price movement in the coming days. By examining these key aspects, we aim to offer valuable insights and predictions for potential investors.
Trend Indicators:
- Moving Averages (MA): The 5-day MA has been consistently above the closing prices, indicating a short-term uptrend.
- MACD: The MACD line has been positive, suggesting bullish momentum.
- MACD Histogram: The histogram has been mostly positive, indicating increasing bullish momentum.
Key Observation: The trend indicators suggest a bullish sentiment in the short term.
Momentum Indicators:
- RSI: The RSI has been fluctuating around the 50 level, indicating a neutral momentum.
- Stochastic Oscillator: Both %K and %D have been relatively high, signaling potential overbought conditions.
- Williams %R: The indicator has been in the oversold territory, suggesting a potential reversal.
Key Observation: Momentum indicators show mixed signals with a slight bias towards a bearish reversal.
Volatility Indicators:
- Bollinger Bands (BB): The price has mostly stayed within the bands, indicating moderate volatility.
- BB Width: The width of the bands has been narrowing, suggesting a potential decrease in volatility.
Key Observation: Volatility indicators point towards a consolidation phase with decreasing volatility.
Volume Indicators:
- On-Balance Volume (OBV): The OBV has shown mixed movements, indicating indecision among market participants.
- Chaikin Money Flow (CMF): The CMF has been negative, suggesting outflow of money from the stock.
Key Observation: Volume indicators reflect uncertainty and a lack of strong buying or selling pressure.
Conclusion:
Based on the analysis of the technical indicators, the next few days for XSHQ could see sideways movement with a slight bearish bias. The trend indicators support a bullish view in the short term, while momentum indicators hint at a potential bearish reversal. Volatility indicators suggest a consolidation phase with decreasing volatility, and volume indicators indicate indecision among investors.
Overall, the stock is likely to experience sideways trading with a slight bearish inclination in the coming days. Investors should exercise caution and closely monitor key support and resistance levels for potential entry or exit points.