Technical Analysis of XSLV 2024-05-10
Overview:
In analyzing the technical indicators for XSLV over the last 5 days, we will delve into the trend, momentum, volatility, and volume indicators to provide a comprehensive outlook on the possible stock price movement in the coming days. By examining these key indicators, we aim to offer valuable insights and predictions for potential price trends.
Trend Indicators:
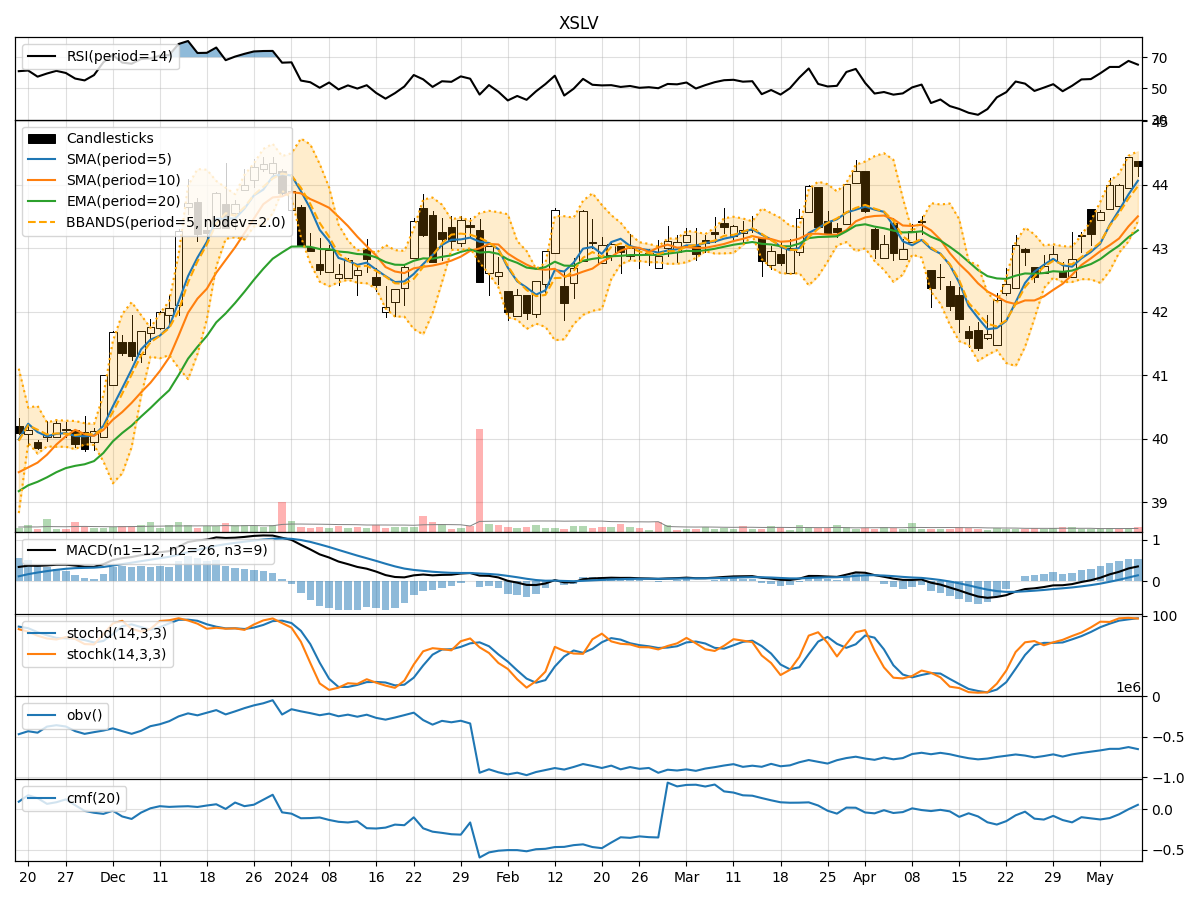
- Moving Averages (MA): The 5-day moving average has been consistently above the longer-term moving averages (SMA and EMA), indicating a short-term bullish trend.
- MACD: The MACD line has been trending upwards, crossing above the signal line, suggesting increasing bullish momentum.
- RSI: The RSI has been in the overbought territory, indicating a strong bullish sentiment in the market.
Momentum Indicators:
- Stochastic Oscillator: Both %K and %D lines have been in the overbought zone, signaling a potential reversal or consolidation.
- Williams %R: The indicator has been in the oversold region, suggesting a possible reversal in the short term.
Volatility Indicators:
- Bollinger Bands: The price has been trading within the bands, indicating a period of consolidation or range-bound movement.
- BB% (Bollinger Band %B): The %B value has been fluctuating around 0.7, suggesting moderate volatility.
Volume Indicators:
- On-Balance Volume (OBV): The OBV has shown mixed signals, indicating indecision among market participants.
- Chaikin Money Flow (CMF): The CMF has been negative, reflecting selling pressure in the stock.
Key Observations:
- The trend indicators suggest a bullish bias in the short term.
- Momentum indicators show signs of potential overbought conditions, hinting at a possible reversal or consolidation.
- Volatility indicators point towards a period of consolidation or sideways movement.
- Volume indicators indicate mixed sentiment among investors, with selling pressure reflected in the CMF.
Conclusion:
Based on the analysis of the technical indicators, the next few days for XSLV could see a potential consolidation phase with a slight bias towards a bullish continuation. However, caution is advised due to the overbought signals in the momentum indicators and the negative CMF. Traders should closely monitor key support and resistance levels for any potential breakout or reversal. Exercise patience and wait for clearer signals before making significant trading decisions.