Technical Analysis of XSMO 2024-05-10
Overview:
In analyzing the technical indicators for XSMO over the last 5 days, we will delve into the trend, momentum, volatility, and volume indicators to provide a comprehensive outlook on the possible stock price movement. By examining these key factors, we aim to offer valuable insights and predictions for the upcoming days.
Trend Indicators:
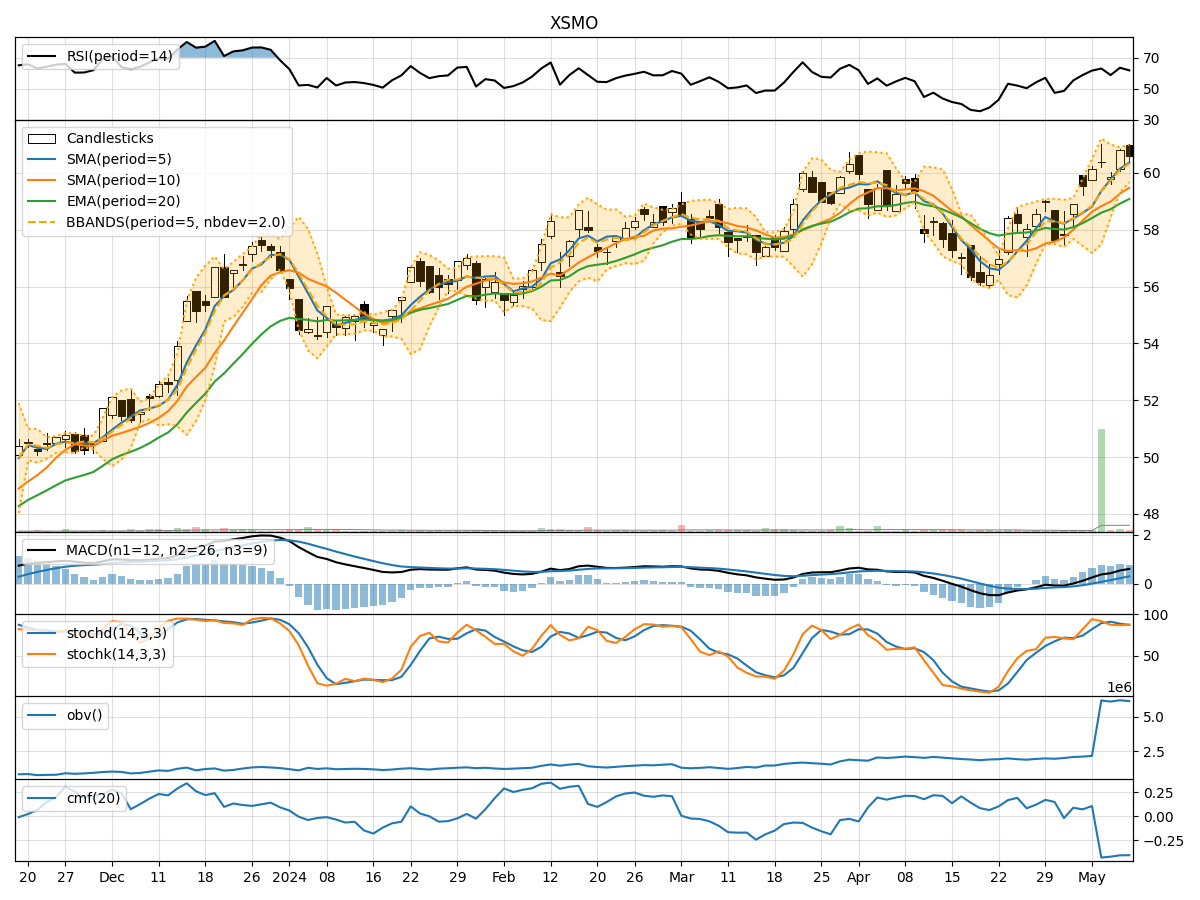
- Moving Averages (MA): The 5-day moving average has been consistently above the longer-term simple moving average (SMA) and exponential moving average (EMA), indicating a short-term bullish trend.
- MACD: The MACD line has been trending upwards, staying above the signal line, suggesting positive momentum in the stock price.
- MACD Histogram: The MACD histogram has been increasing, indicating strengthening bullish momentum.
Momentum Indicators:
- RSI: The Relative Strength Index (RSI) has been fluctuating in the overbought territory, suggesting a potential overvaluation of the stock.
- Stochastic Oscillator: Both %K and %D have been relatively high, indicating a strong bullish momentum.
- Williams %R: The Williams %R has been hovering in the oversold region, signaling a potential reversal in the stock price.
Volatility Indicators:
- Bollinger Bands: The stock price has been trading within the Bollinger Bands, with the bands widening slightly, indicating increased volatility.
- Bollinger %B: The %B indicator has been fluctuating within the bands, suggesting potential shifts in price direction.
Volume Indicators:
- On-Balance Volume (OBV): The OBV has shown mixed signals, with fluctuations in volume accumulation, indicating indecision among investors.
- Chaikin Money Flow (CMF): The CMF has been negative, reflecting selling pressure in the stock.
Key Observations:
- The trend indicators suggest a bullish sentiment in the short term.
- Momentum indicators show conflicting signals, with RSI indicating potential overbought conditions.
- Volatility indicators point towards increased price fluctuations.
- Volume indicators reflect uncertainty in investor sentiment.
Conclusion:
Based on the analysis of the technical indicators, the next few days' possible stock price movement for XSMO is likely to experience a period of consolidation. The conflicting signals from momentum indicators and the mixed volume accumulation suggest a potential lack of clear direction in the market. While the trend indicators remain bullish, the overbought conditions indicated by RSI and the negative CMF signal caution against expecting significant upward movement. Therefore, investors should be prepared for a period of sideways trading or a slight downward correction in the stock price.