Technical Analysis of XSVN 2024-05-10
Overview:
In analyzing the technical indicators for XSVN over the last 5 days, we will delve into the trend, momentum, volatility, and volume indicators to provide a comprehensive outlook on the possible stock price movement in the coming days. By examining these key aspects, we aim to offer valuable insights and predictions for informed decision-making.
Trend Analysis:
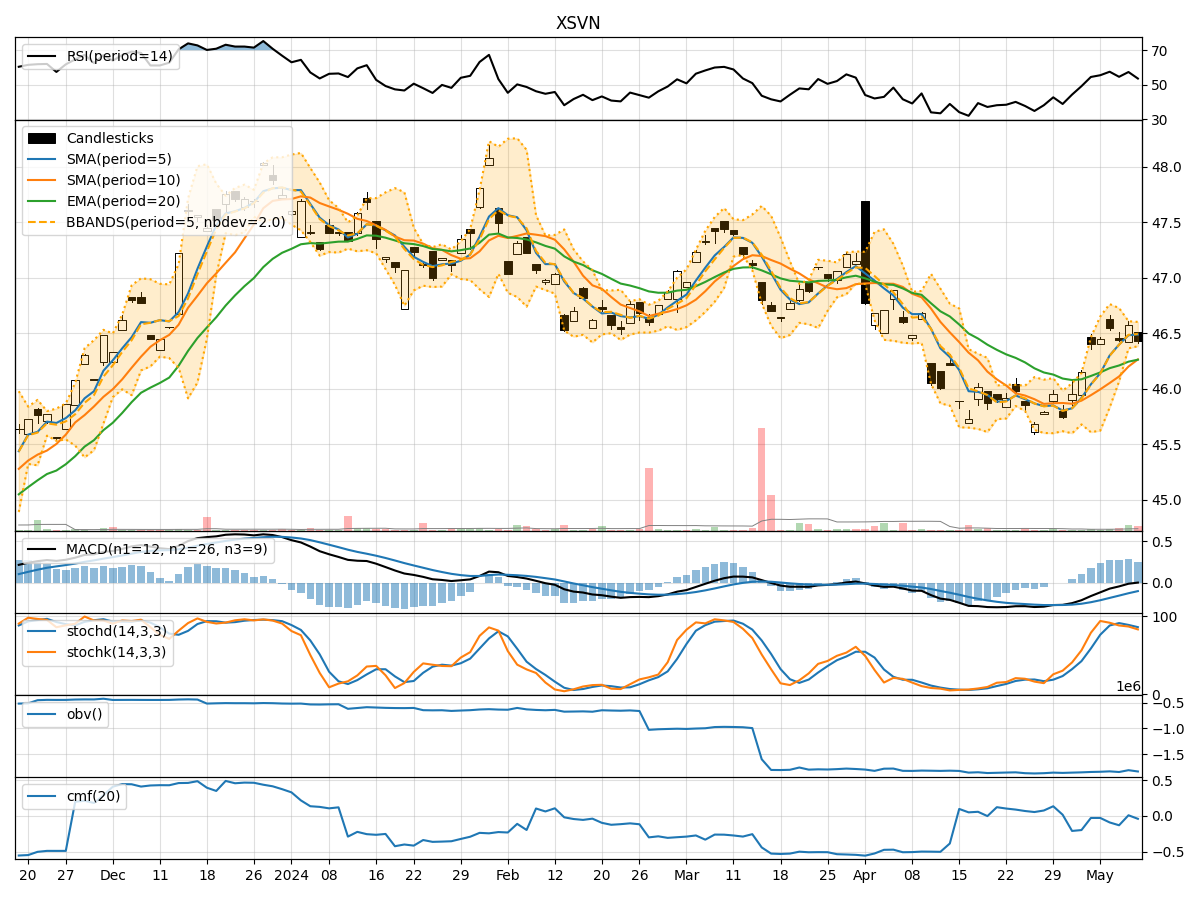
- Moving Averages (MA): The 5-day MA has been consistently above the closing prices, indicating a short-term uptrend.
- MACD: The MACD line has been positive, with the MACD histogram showing an increasing trend, suggesting bullish momentum.
- EMA: The EMA has been trending slightly upwards, supporting the bullish sentiment.
Momentum Analysis:
- RSI: The RSI has been fluctuating around the neutral zone, indicating a lack of strong momentum.
- Stochastic Oscillator: Both %K and %D have been declining, signaling a potential reversal in momentum.
- Williams %R: The indicator has been in oversold territory, suggesting a possible upcoming bullish reversal.
Volatility Analysis:
- Bollinger Bands (BB): The bands have been narrowing, indicating decreasing volatility and a potential price breakout.
- Bollinger Band %B: The %B indicator has been hovering around the middle, reflecting a balanced market sentiment.
Volume Analysis:
- On-Balance Volume (OBV): The OBV has been fluctuating, indicating indecision among market participants.
- Chaikin Money Flow (CMF): The CMF has been negative, suggesting selling pressure in the market.
Key Observations:
- The trend indicators suggest a bullish bias in the short term.
- Momentum indicators show mixed signals, with a potential for a bullish reversal.
- Volatility is decreasing, hinting at a possible consolidation phase.
- Volume indicators reflect uncertainty and lack of strong buying interest.
Conclusion:
Based on the analysis of the technical indicators, the next few days for XSVN could see sideways movement with a slight upward bias. Traders should closely monitor the momentum indicators for a potential bullish reversal confirmation. Additionally, keeping an eye on the volatility for any breakout signals and volume for increased buying interest will be crucial in making informed trading decisions. Overall, a cautious approach with a focus on key reversal signals is recommended in the current market environment.