Technical Analysis of XSW 2024-05-10
Overview:
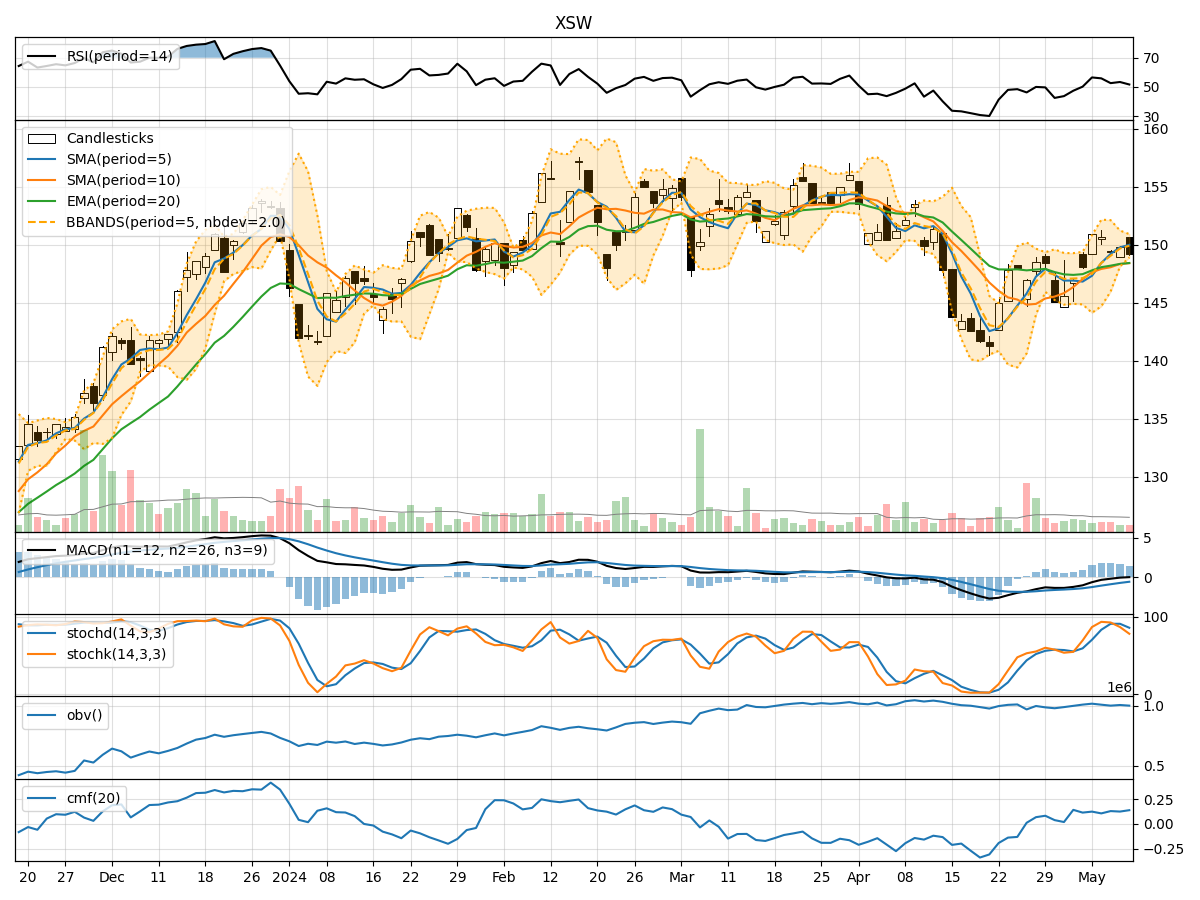
In analyzing the technical indicators for XSW over the last 5 days, we will delve into the trend, momentum, volatility, and volume indicators to provide a comprehensive outlook on the possible stock price movement in the coming days. By examining these key indicators, we aim to offer valuable insights and predictions for potential investors.
Trend Analysis:
- Moving Averages (MA): The 5-day Moving Average (MA) has been consistently above the Simple Moving Average (SMA) and Exponential Moving Average (EMA), indicating a bullish trend.
- MACD: The MACD line has been consistently below the signal line, suggesting a bearish trend.
- MACD Histogram: The MACD Histogram has been decreasing, indicating a weakening bearish momentum.
Momentum Analysis:
- RSI: The Relative Strength Index (RSI) has been fluctuating around the 50 level, indicating a neutral momentum.
- Stochastic Oscillator: Both %K and %D have been declining, signaling a bearish momentum.
- Williams %R: The Williams %R is in oversold territory, suggesting a potential reversal.
Volatility Analysis:
- Bollinger Bands: The stock price has been trading within the Bollinger Bands, with the bands narrowing, indicating decreasing volatility.
- Bollinger %B: The %B indicator is below 0.2, suggesting the stock is oversold.
Volume Analysis:
- On-Balance Volume (OBV): The OBV has been fluctuating, indicating indecision among investors.
- Chaikin Money Flow (CMF): The CMF has been positive, suggesting buying pressure in the market.
Key Observations:
- The trend indicators show a conflicting picture with the moving averages indicating a bullish trend, while the MACD signals a bearish trend.
- Momentum indicators suggest a bearish sentiment with the Stochastic Oscillator and RSI pointing downwards.
- Volatility has been decreasing, indicating a potential consolidation phase.
- Volume indicators show mixed signals with OBV fluctuating and CMF indicating buying pressure.
Conclusion:
Based on the analysis of the technical indicators, the next few days' possible stock price movement for XSW is likely to be sideways with a slight bearish bias. The conflicting signals from trend and momentum indicators suggest a lack of clear direction in the short term. However, the decreasing volatility and oversold conditions indicated by Williams %R and Bollinger %B may lead to a period of consolidation before a potential reversal. Investors should closely monitor key support and resistance levels for potential entry or exit points.
Recommendation:
- Short-term Traders: Consider staying on the sidelines or implementing range-bound strategies due to the lack of a clear trend.
- Long-term Investors: Monitor the price action for a potential reversal signal before considering entry or accumulation.
By combining insights from various technical indicators, investors can make informed decisions and adapt their strategies to the evolving market conditions.