Technical Analysis of XTJA 2024-05-10
Overview:
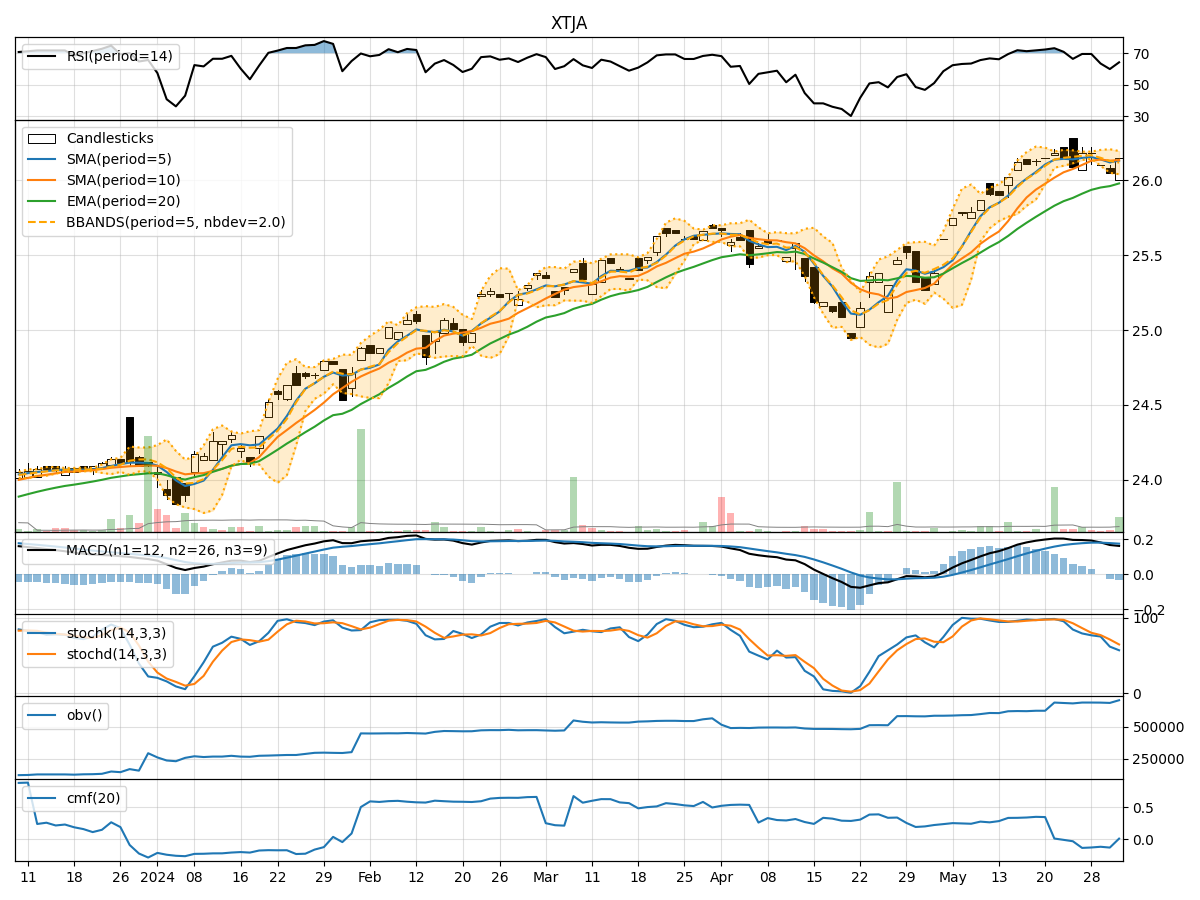
In the last 5 trading days, XTJA stock has shown a consistent uptrend in both price and volume. The moving averages have been steadily increasing, indicating a bullish trend. Momentum indicators such as RSI and Stochastic oscillators suggest the stock is in overbought territory but still showing strength. Volatility indicators like Bollinger Bands show a narrowing range, potentially signaling a period of consolidation. Volume indicators like OBV and CMF are positive, supporting the recent price increase.
Trend Analysis:
- Moving Averages (MA): The 5-day MA has been consistently above the 10-day SMA and 20-day EMA, indicating a strong uptrend.
- MACD: The MACD line has been above the signal line, with both lines trending upwards, suggesting bullish momentum.
Momentum Analysis:
- RSI: The RSI has been in the overbought zone, indicating a potential pullback or consolidation in the near term.
- Stochastic Oscillators: Both %K and %D have been in the overbought region, signaling a possible reversal or correction.
Volatility Analysis:
- Bollinger Bands (BB): The bands have been narrowing, suggesting a decrease in volatility and a potential period of consolidation.
Volume Analysis:
- On-Balance Volume (OBV): The OBV has been steadily increasing, indicating strong buying pressure and confirming the uptrend.
- Chaikin Money Flow (CMF): The CMF has been positive, indicating that money is flowing into the stock.
Key Observations:
- The stock is currently in a strong uptrend based on moving averages and MACD.
- Momentum indicators suggest the stock is overbought and may experience a pullback or consolidation.
- Volatility is decreasing, indicating a potential period of consolidation.
- Volume indicators support the recent price increase, showing strong buying pressure.
Conclusion:
Based on the technical analysis of XTJA stock: - Short-Term: The stock may experience a slight pullback or consolidation due to overbought conditions indicated by momentum indicators. - Medium- to Long-Term: The overall trend remains bullish, supported by moving averages and volume indicators.
Recommendation:
- Short-Term Traders: Consider taking profits or waiting for a better entry point during a potential pullback.
- Long-Term Investors: Hold onto the stock as the overall trend is bullish, but monitor for signs of a trend reversal.
Final Verdict:
The next few days may see sideways movement or a slight pullback in XTJA stock price due to overbought conditions, but the overall trend remains upward.