Technical Analysis of XTJL 2024-05-10
Overview:
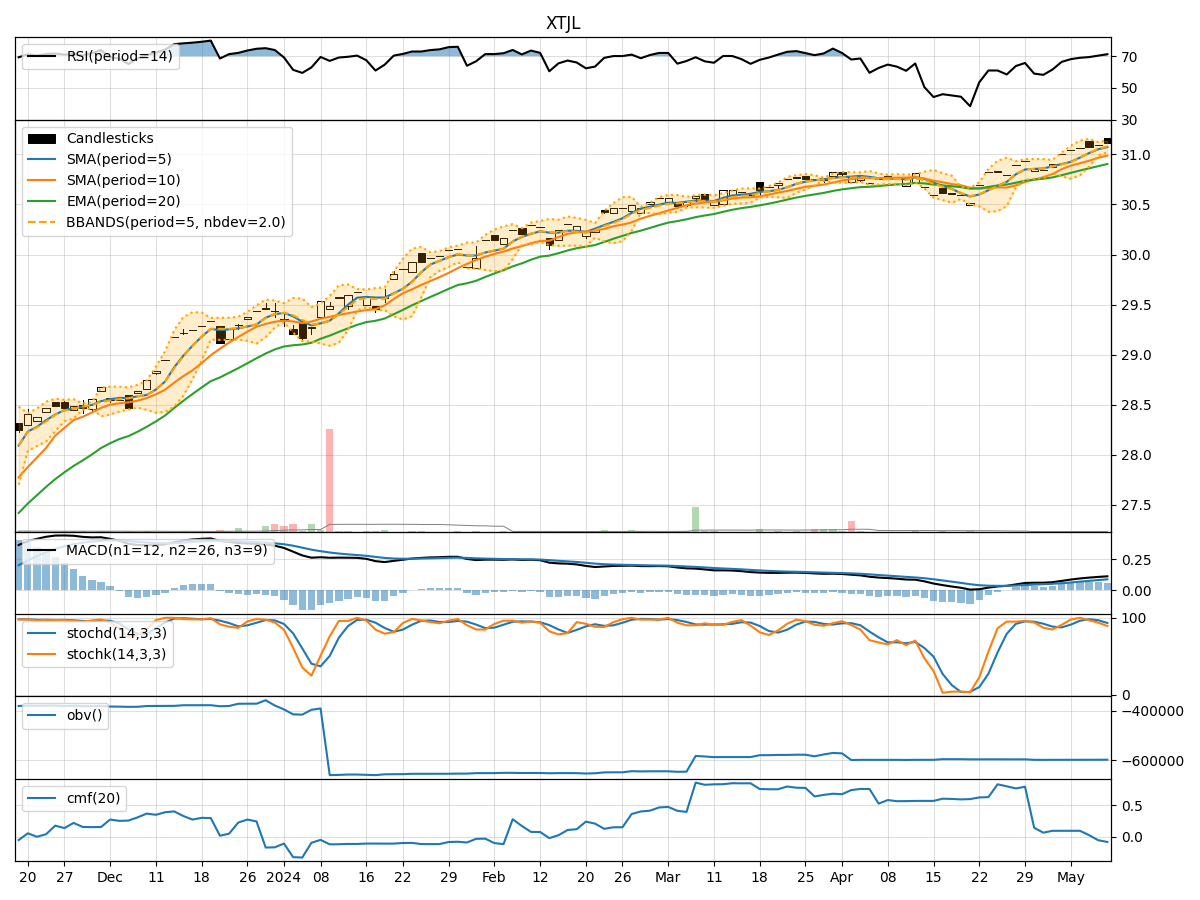
In analyzing the technical indicators for XTJL stock over the last 5 days, we will delve into the trend, momentum, volatility, and volume indicators to provide a comprehensive outlook on the possible future stock price movement. By examining these key indicators, we aim to offer valuable insights and recommendations for potential trading strategies.
Trend Indicators:
- Moving Averages (MA): The 5-day Moving Average (MA) has been consistently above the Simple Moving Average (SMA) and Exponential Moving Average (EMA), indicating a bullish trend.
- MACD: The MACD line has been steadily increasing above the signal line, suggesting bullish momentum.
- MACD Histogram: The MACD Histogram has been positive and rising, further supporting the bullish trend.
Momentum Indicators:
- RSI: The Relative Strength Index (RSI) has been trending upwards and is in the overbought territory, signaling strong buying momentum.
- Stochastic Oscillator: Both %K and %D lines of the Stochastic Oscillator have been declining but remain in the overbought zone, indicating a potential reversal.
- Williams %R: The Williams %R is in the oversold region, suggesting a possible buying opportunity.
Volatility Indicators:
- Bollinger Bands: The price has been trading within the Bollinger Bands, with the bands narrowing, indicating decreasing volatility.
- Bollinger %B: The %B indicator is hovering around 0.8, suggesting the stock is trading near the upper band.
Volume Indicators:
- On-Balance Volume (OBV): The OBV has been slightly increasing, indicating a potential accumulation phase.
- Chaikin Money Flow (CMF): The CMF has been fluctuating around zero, signaling a balance between buying and selling pressure.
Key Observations:
- The trend indicators suggest a strong bullish sentiment in the short term.
- Momentum indicators show mixed signals with overbought conditions, indicating a potential reversal or consolidation.
- Volatility indicators point towards decreasing volatility and a possible period of consolidation.
- Volume indicators reflect a slight increase in buying pressure but with a balanced CMF.
Conclusion:
Based on the analysis of the technical indicators, the next few days for XTJL stock are likely to see further upward movement in the price, supported by the bullish trend and positive momentum. However, caution is advised as the stock is in overbought territory, and a potential reversal or consolidation phase could be on the horizon. Traders should closely monitor price action and key support/resistance levels for timely decision-making.