Technical Analysis of XTL 2024-05-10
Overview:
In analyzing the technical indicators for XTL over the last 5 days, we will delve into the trend, momentum, volatility, and volume indicators to provide a comprehensive outlook on the possible stock price movement in the coming days. By examining these key aspects, we aim to offer valuable insights and predictions for potential investors and traders.
Trend Indicators:
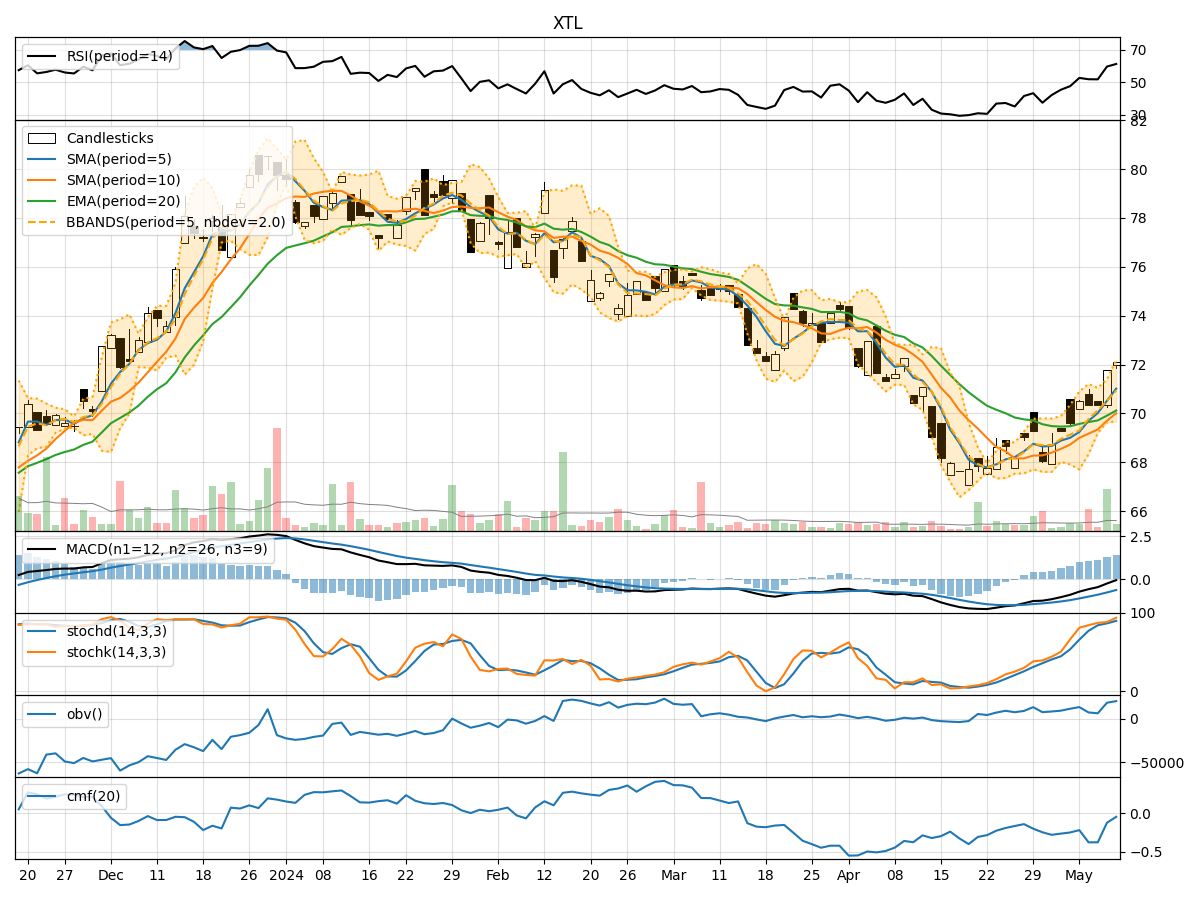
- Moving Averages (MA): The 5-day MA has been consistently above the closing prices, indicating a bullish trend.
- MACD: The MACD line has been gradually increasing, showing a positive momentum in the stock price.
- RSI: The RSI has been fluctuating around the neutral zone, suggesting a balanced momentum.
Momentum Indicators:
- Stochastic Oscillator: Both %K and %D have been in the overbought territory, signaling a potential reversal or consolidation.
- Williams %R: The indicator has been hovering around the oversold region, indicating a possible buying opportunity.
Volatility Indicators:
- Bollinger Bands: The bands have been widening, suggesting increased volatility in the stock price.
- Average True Range (ATR): The ATR has shown an uptrend, indicating rising volatility levels.
Volume Indicators:
- On-Balance Volume (OBV): The OBV has been fluctuating, reflecting mixed sentiment among investors.
- Chaikin Money Flow (CMF): The CMF has been negative, indicating selling pressure in the stock.
Key Observations:
- The trend indicators point towards a bullish sentiment in the short term.
- Momentum indicators suggest a potential reversal or consolidation due to overbought conditions.
- Volatility indicators indicate an increase in price fluctuations.
- Volume indicators reflect mixed sentiment among market participants.
Conclusion:
Based on the analysis of the technical indicators, the next few days' possible stock price movement for XTL is likely to experience a period of consolidation or a minor pullback. The bullish trend may pause temporarily due to overbought conditions indicated by the momentum indicators. Investors should exercise caution and consider waiting for a clearer signal before making significant trading decisions. It is advisable to monitor the price action closely for any signs of a reversal or continuation of the current trend.