Technical Analysis of XTN 2024-05-10
Overview:
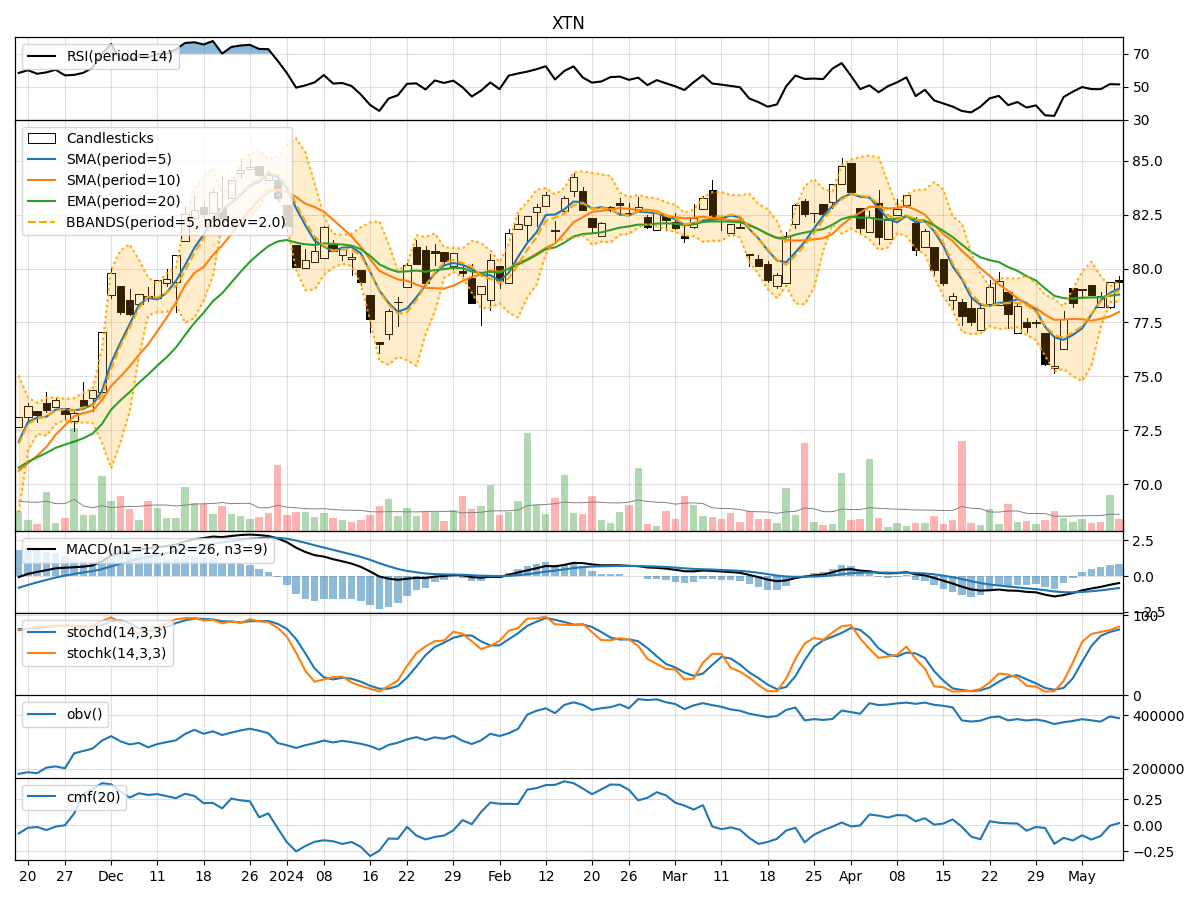
In the last 5 trading days, XTN has shown a mix of price movements and technical indicators. The stock has been fluctuating within a certain range, with some indicators suggesting potential bullish momentum while others indicate a more neutral stance. By analyzing the trend, momentum, volatility, and volume indicators, we can gain a comprehensive understanding of the stock's potential future price movement.
Trend Indicators:
- Moving Averages (MA): The 5-day MA has been consistently above the longer-term SMAs and EMAs, indicating a short-term bullish trend.
- MACD: The MACD line has been negative but showing signs of convergence towards the signal line, suggesting a potential shift towards bullish momentum.
- MACD Histogram: The MACD histogram has been gradually increasing, indicating strengthening bullish momentum.
Momentum Indicators:
- RSI: The RSI has been hovering around the mid-level, indicating a neutral stance in terms of momentum.
- Stochastic Oscillator: Both %K and %D have been in the overbought territory, suggesting a potential reversal or consolidation.
- Williams %R: The Williams %R is also in the oversold region, indicating a potential reversal in the short term.
Volatility Indicators:
- Bollinger Bands: The stock price has been trading within the Bollinger Bands, with the bands narrowing, suggesting a period of consolidation.
- Bollinger %B: The %B indicator is hovering around the mid-level, indicating a balanced market sentiment.
Volume Indicators:
- On-Balance Volume (OBV): The OBV has shown mixed movements, indicating a lack of strong accumulation or distribution.
- Chaikin Money Flow (CMF): The CMF has been negative, suggesting some selling pressure in the market.
Key Observations and Opinions:
- Trend: The trend indicators suggest a potential bullish bias in the short term.
- Momentum: Momentum indicators show a mixed picture, with some pointing towards a potential reversal or consolidation.
- Volatility: Volatility indicators indicate a period of consolidation and range-bound trading.
- Volume: Volume indicators suggest a lack of strong buying or selling pressure.
Conclusion:
Based on the analysis of the technical indicators, the next few days for XTN could see sideways movement with a slight bullish bias. Traders should watch for a potential breakout above the recent highs for a confirmation of a bullish trend continuation. However, caution is advised as some momentum indicators suggest a possible reversal or consolidation in the short term. It is essential to monitor key support and resistance levels closely to navigate potential price movements effectively.