Technical Analysis of XTWO 2024-05-10
Overview:
In analyzing the technical indicators for XTWO over the last 5 days, we will delve into the trend, momentum, volatility, and volume indicators to provide a comprehensive outlook on the possible stock price movement in the coming days. By examining these key indicators, we aim to offer valuable insights and predictions for informed decision-making.
Trend Analysis:
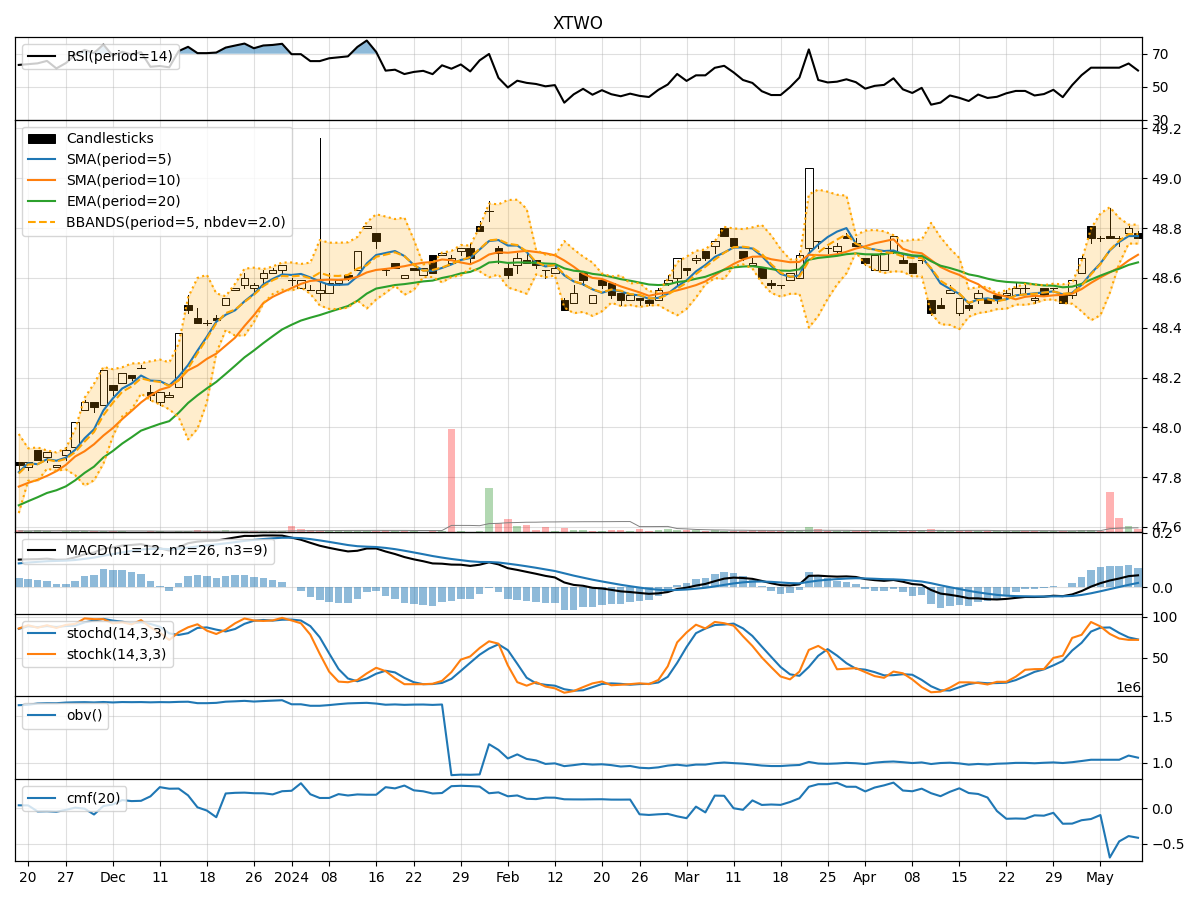
- Moving Averages (MA): The 5-day MA has been relatively stable around the closing price, indicating a consistent trend.
- MACD: The MACD line has shown a positive trend, with the MACD histogram and signal line also trending upwards gradually.
Momentum Analysis:
- RSI: The RSI has been fluctuating around the neutral level of 50, suggesting a balanced momentum.
- Stochastic Oscillator: Both %K and %D have been hovering in the neutral zone, indicating a lack of strong momentum in either direction.
Volatility Analysis:
- Bollinger Bands (BB): The bands have been relatively narrow, indicating low volatility in the stock price.
- Bollinger %B: The %B indicator has been fluctuating around the middle range, reflecting a lack of extreme price movements.
Volume Analysis:
- On-Balance Volume (OBV): The OBV has shown mixed signals, with no clear trend in volume accumulation or distribution.
- Chaikin Money Flow (CMF): The CMF has been negative, suggesting a slight outflow of money from the stock.
Key Observations:
- The stock has been trading in a relatively tight range with stable moving averages and low volatility.
- Momentum indicators show a lack of strong directional momentum, indicating a potential consolidation phase.
- Volume indicators do not provide a clear signal of significant buying or selling pressure.
Conclusion:
Based on the analysis of the technical indicators, the stock is likely to experience sideways movement in the coming days. The lack of strong trends in both momentum and volume, coupled with low volatility, suggests a period of consolidation. Traders may expect the stock price to remain range-bound without significant upward or downward movements. It is advisable to closely monitor key support and resistance levels for potential breakout opportunities in the future.